


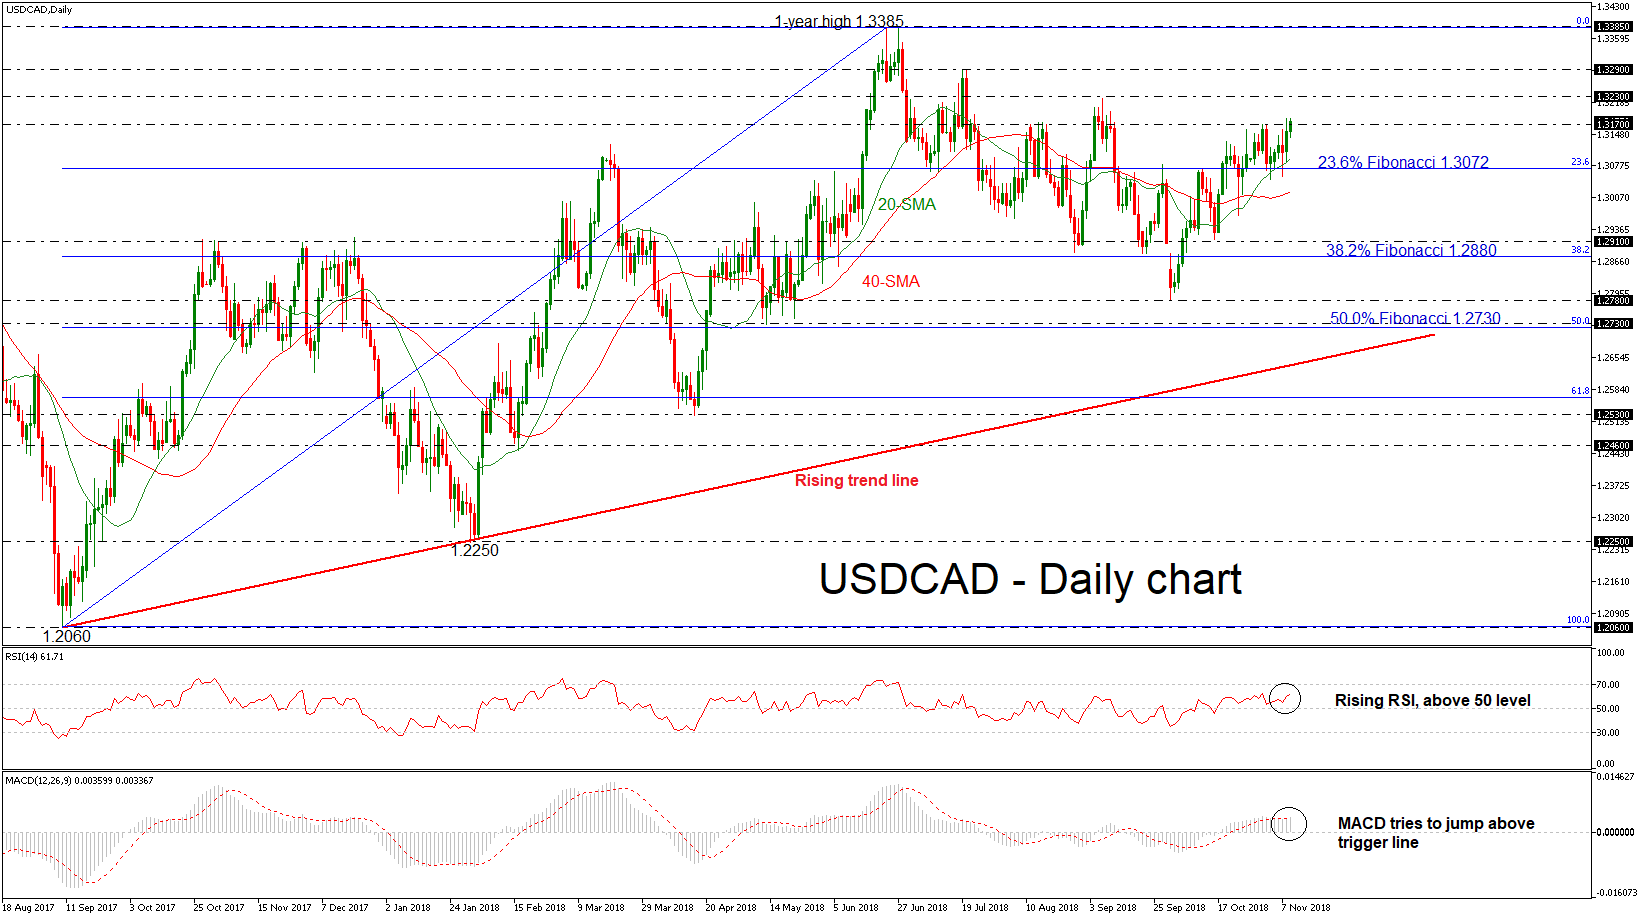
 USDCAD is challenging the 1.3170 resistance level after it failed several times to close below the 23.6% Fibonacci retracement level of the upleg from 1.2060 to 1.3385, around 1.3072. According to the RSI, the market could maintain positive momentum in the short-term as the indicator is positively sloped above its neutral threshold of 50, while the MACD oscillator is ready to post a bullish crossover with its trigger line in the daily chart.
In case of a significant leg above the 1.3170 barrier, the market could meet the 1.3230 resistance, taken from the highs on September 6. The next level in focus could be the 1.3290 mark since any strong violation of this point could increase chances for further gains probably towards the one-year high of 1.3385.
In the wake of more negative pressures and a slip below the 20-day simple moving average (SMA) and the 23.6% Fibonacci, the market could meet support at the 40-day SMA near 1.3020 at the time of writing. A drop below this level could see a retest of the previous trough of 1.2910, while in case of steeper declines the price could breach this bottom and dive to the 38.2% Fibonacci of 1.2880.
Turning to the long-term view, the market seems to be in a strong bullish mode given that USDCAD trades above the ascending trend line, which has been holding since September 2014. But, in the medium-term, the pair looks to be negative over the last four months, creating lower lows and lower highs.
Origin: XM


