


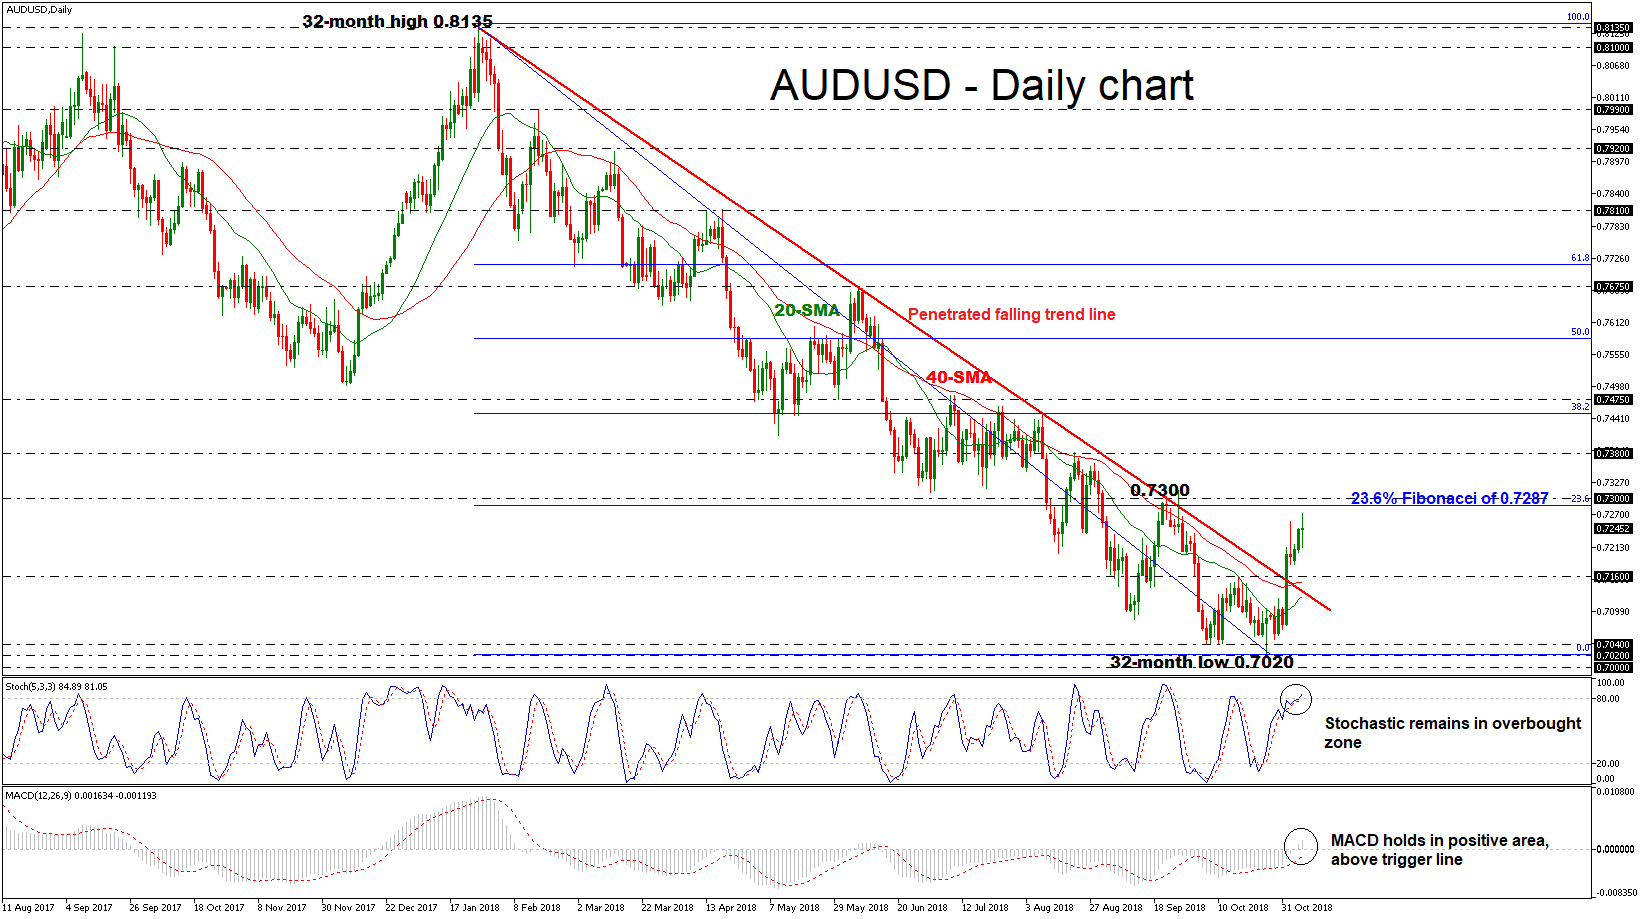
 AUDUSD recorded a stunning rally last week, surpassing the long-term descending trend line. Earlier today, the pair reached a fresh six-week high of 0.7271 but returned quickly near its opening level. The price has almost violated the fall off 0.7314 turning somewhat neutral, with the technical indicators suggesting further upside to folllow up.
Looking at the daily timeframe, the stochastic oscillator entered the overbought zone with strong momentum and the MACD oscillator jumped above its trigger and zero line. Moreover, the simple moving averages (SMAs) changed direction to the upisde, supporting the recent positive price action.
If the market manages to pick up speed, the 23.6% Fibonacci retracement level of the downleg from 0.8135 to 0.7020, around the 0.7300 handle could offer nearby resistance to the bulls. A significant close above this level could raise chances for further increases, shifting focus to the 0.7380 barrier, taken from the high on August 21.
However, should prices decline, the pair could pare the last three days gains and hit support at the 0.7160 level, which stands near the 40-day SMA. A decisive move below this hurdle could open the way towards the key area within the 0.7000 psychological level and the 0.7040 mark, which encapsulates the 32-month low of 0.7020.
To summarize, AUDUSD is in progress to develop an upside tendency after it penetrated the long-term falling trendline. A climb above the 50.0% Fibonacci, which coincides with the 100-week SMA, would endorse the bullish structure.
Origin: XM


