


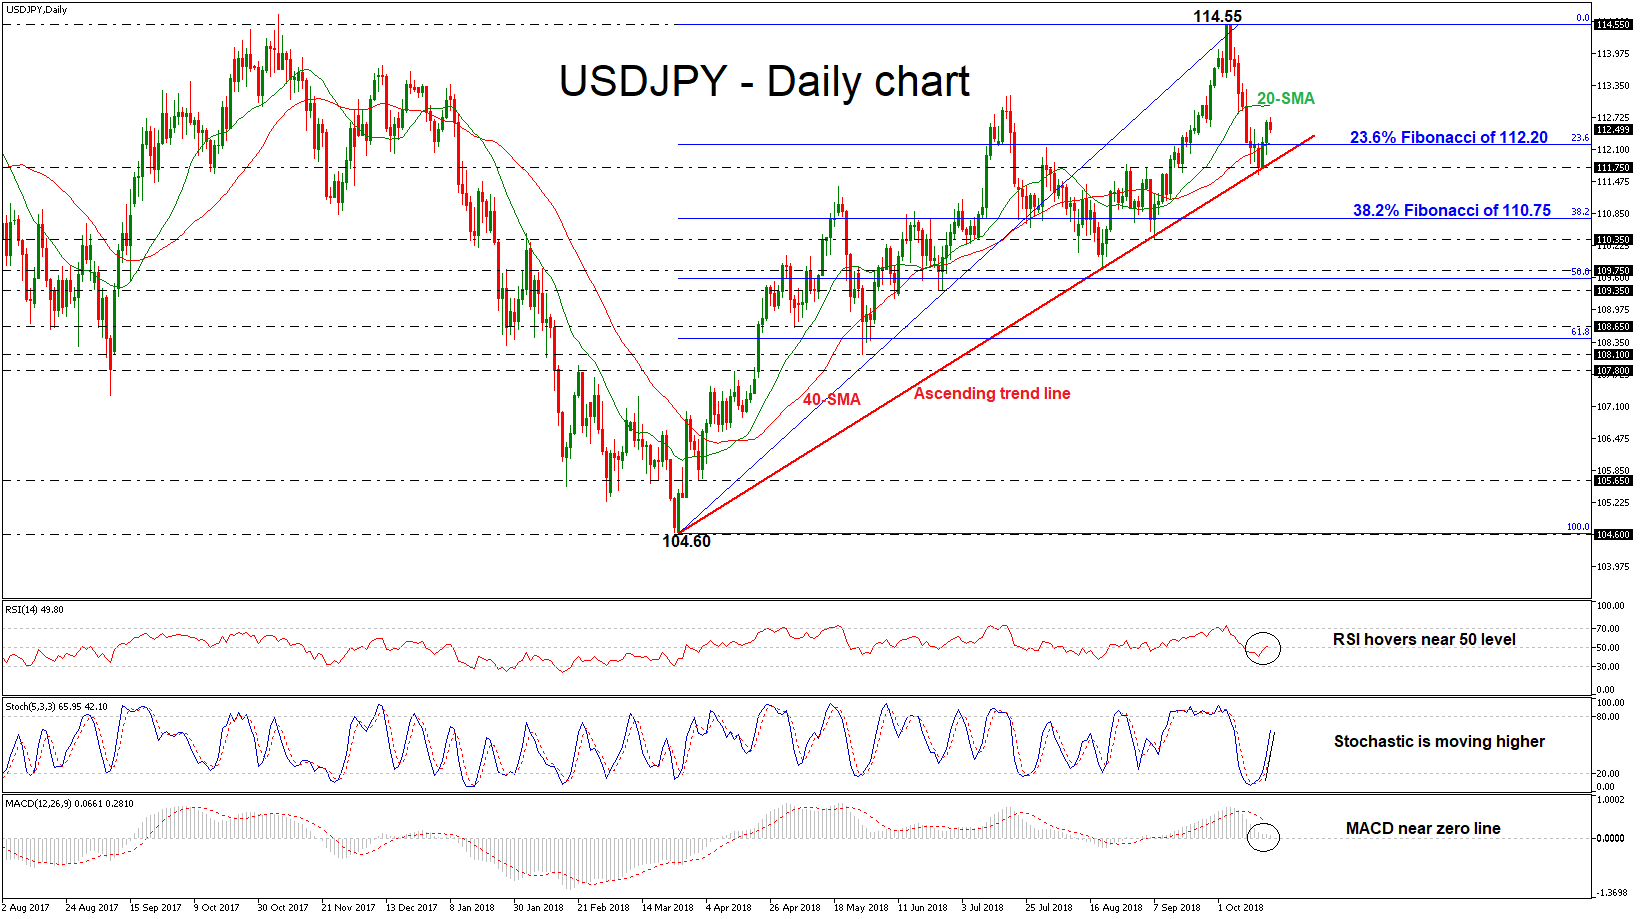
 USDJPY posted a rebound after the bounce off the medium-term ascending trend line in the previous two days, surpassing the 23.6% Fibonacci retracement level of the upleg from 104.60 to 114.55, around 112.20. The price continues the bullish outlook in the daily timeframe as it failed to slip below the diagonal line, however the technical indicators are sending soft signals.
The RSI indicator is flattening near the threshold of 50, while the blue %K line of the stochastic oscillator completed a bullish crossover with the %D line in the oversold zone and are moving higher, suggesting further upside retracement in the market. The MACD oscillator is moving sideways below the trigger line and slightly above the zero line.
If the market manages to pick up speed, the price could re-touch the 20-day SMA around the 113.00 round number. A significant jump above this barrier, traders could find resistance at the 11-month high of 114.55. Even higher, the pair could move towards the 115.50 high, reached on March 2017, posting a new peak.
However, should the price decline further and drop below the 23.6% Fibonacci, it could re-challenge the 111.75 support. A dive below the rising trend line could send prices until the 38.2% Fibonacci mark near 110.75.
In the medium-term, the outlook remains positive since prices hold above the uptrend line, which has been standing since March 26. If USDJPY breaks below this significant level, it would change the outlook to a more neutral to negative one.
Origin: XM


