


 4 hour
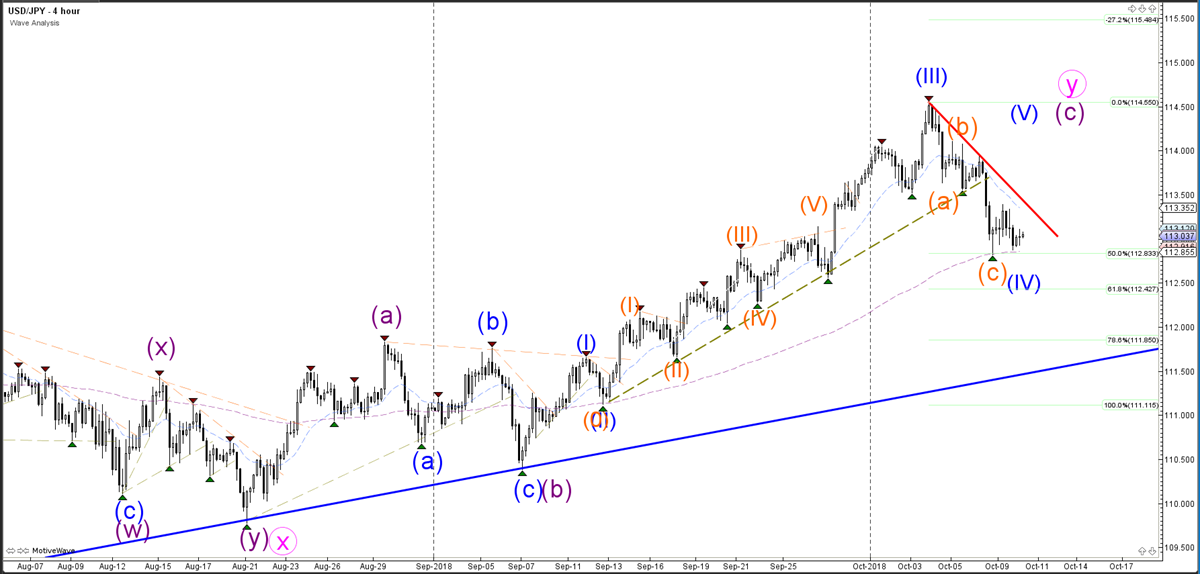
The USD/JPY currency pair is testing a key support level and decision zone. The 50% Fibonacci retracement level at 112.83 is a critical bounce or break spot for the wave 4 pattern (blue). A bearish break could see the price test another key support zone at 112.50, but a break below that could indicate a downtrend. A bullish breakout above the resistance trend line (red) could indicate an uptrend continuation.
1 hour
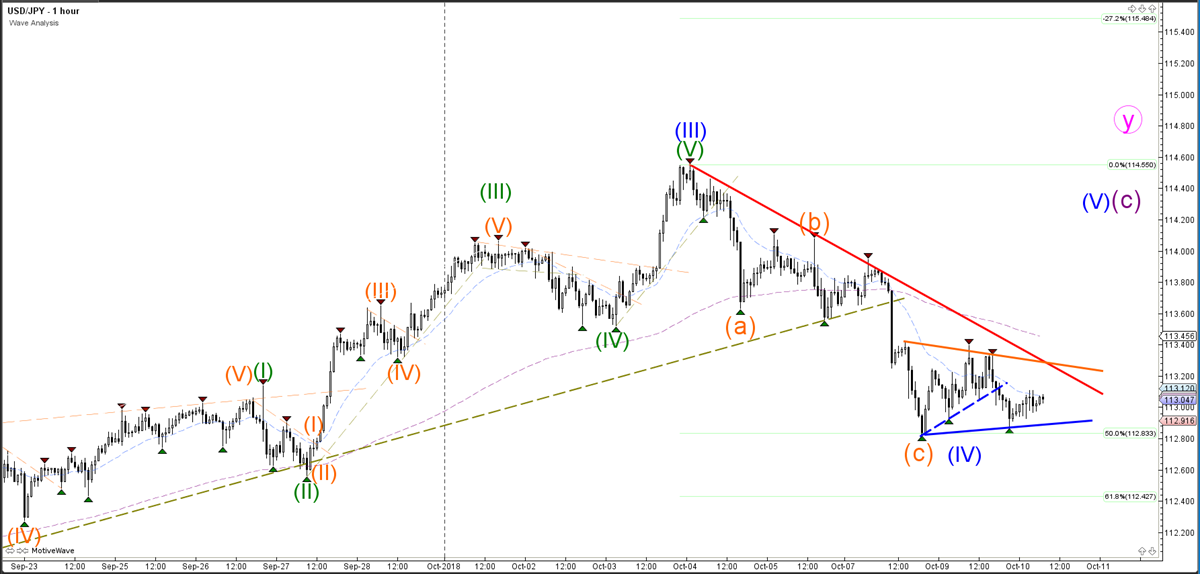
The USD/JPY is building a triangle pattern, and the breakout direction will depend on candlestick patterns that push through support (blue) or resistance (red), and whether the price has a better chance of moving higher or lower.
4 hour
1 hour
Origin: Admiral Markets


