


 4 hour
The GBP/USD is challenging the resistance trend line (red), where a bullish breakout could see the price continue to the Fibonacci targets of wave Y vs W, whereas a bearish bounce could see a move back to the support trend line (blue). The angle of the resistance trend line is converging with the support, which is indicating a rising wedge chart pattern.
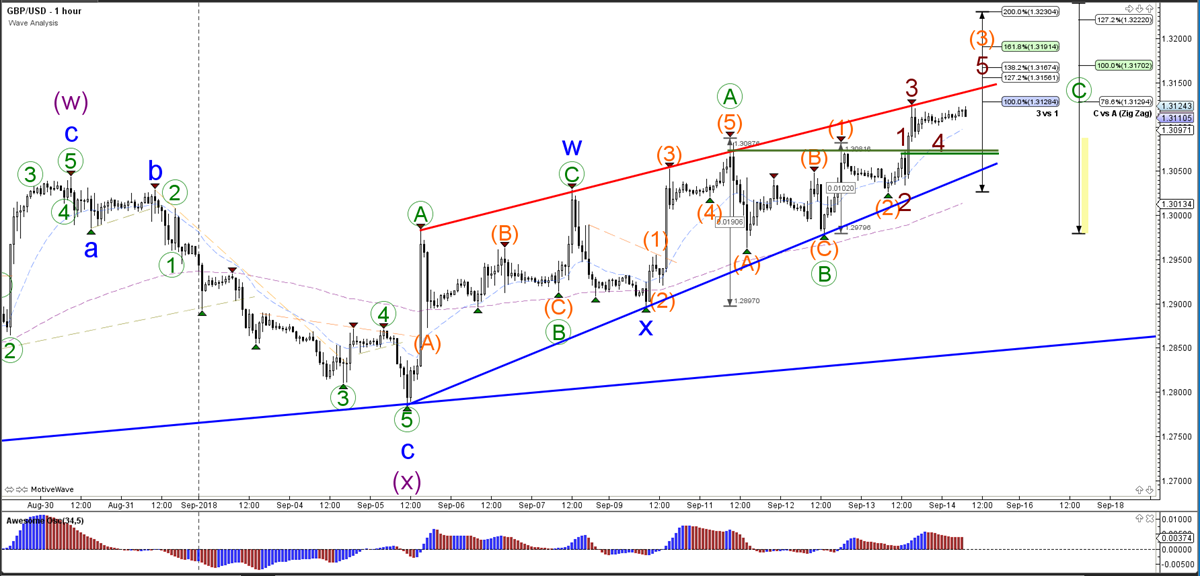
1 hour
The GBP/USD is in a potential wave 4 (dark red) as long as price stays above the top of wave 1 which is indicated by the green trend line. A bullish continuation could be part of a wave 5 of wave 3 (orange).
4 hour

1 hour
Origin: Admiral Markets


