


 GBPUSD recorded a respectable bullish rally over the last three days after it created a new 13-month low of 1.2660 on August 15. The price seems to be in an upward correction mode as the short-term technical indicators confirm.
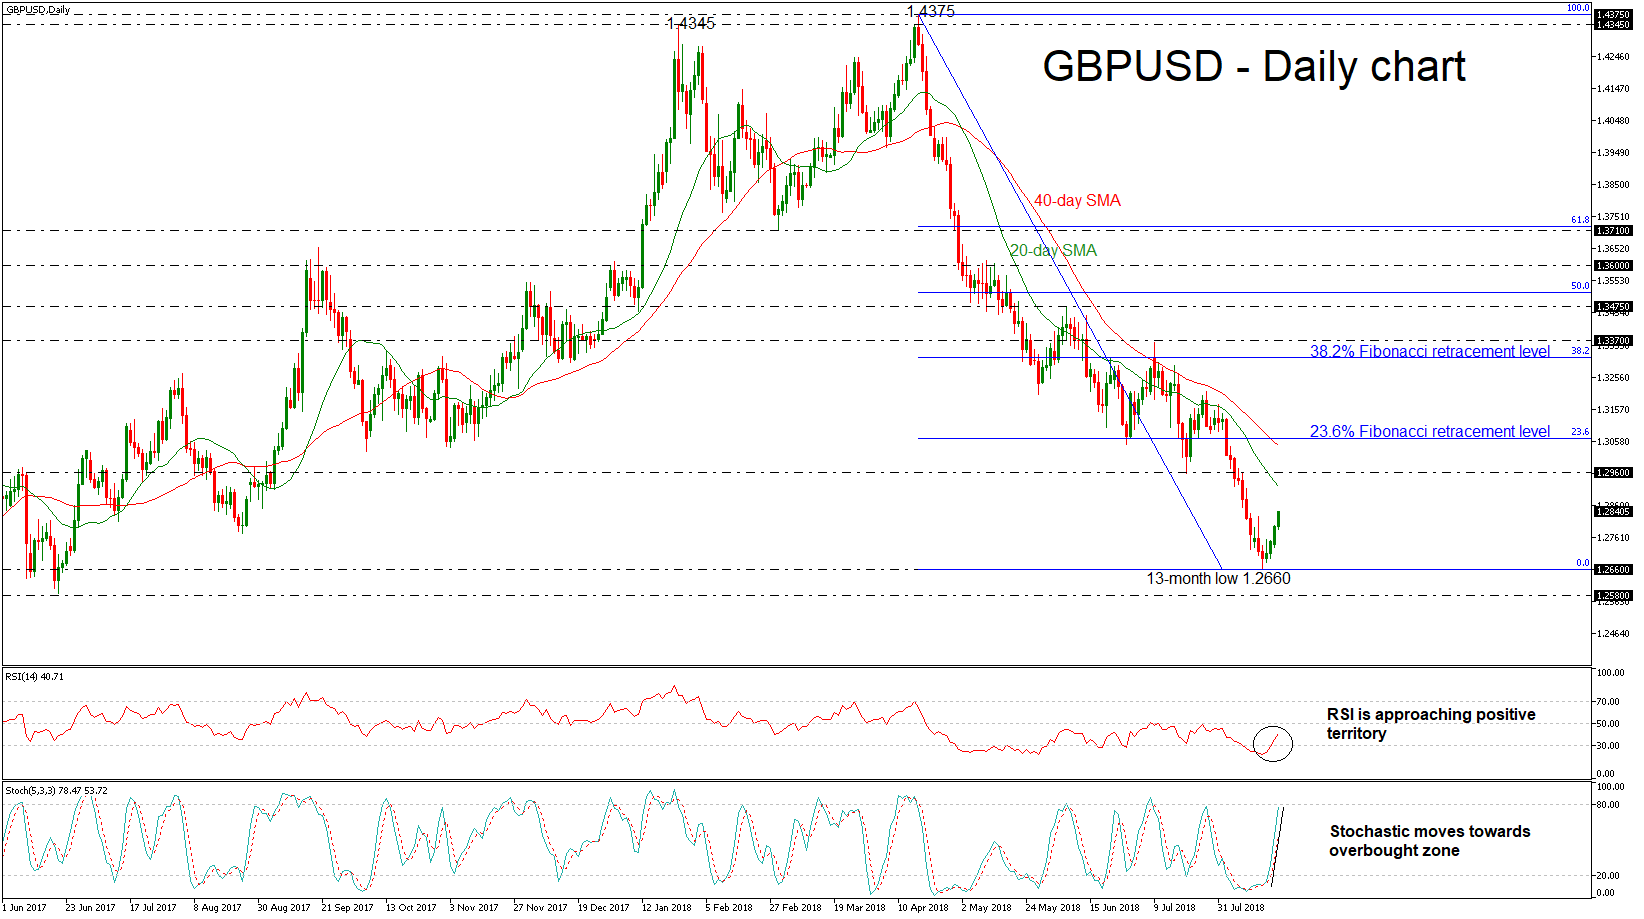
The RSI indicator is currently increasing positive momentum towards its neutral threshold of 50 after an exit from oversold levels, while the green %K line of the stochastic oscillator followed by the red % D line is moving towards the overbought area. However, the cable is still trading below the 20- and 40-simple moving averages (SMAs), signaling that the medium-term bearish outlook still stands.
Should the market extend gains, resistance could be met between the 20-SMA at 1.2920 and the 1.2960 resistance barrier. A significant leg above this area could send prices towards the 23.6% Fibonacci retracement level of the downleg from 1.4375 to 1.2660, around 1.3066. The 40-SMA is also placed around this level at the moment, giving some importance to the area.
On the flip side, if the pair retreats, immediate support could come from the 1.2660 key level. Below that downside pressure could strengthen until the 1.2580 barrier, taken from the low on June 21.
Turning to the medium-term picture, the outlook remains negative as long as GBPUSD maintains the steep downfall from the 1.4375 peak.
Origin: XM


