


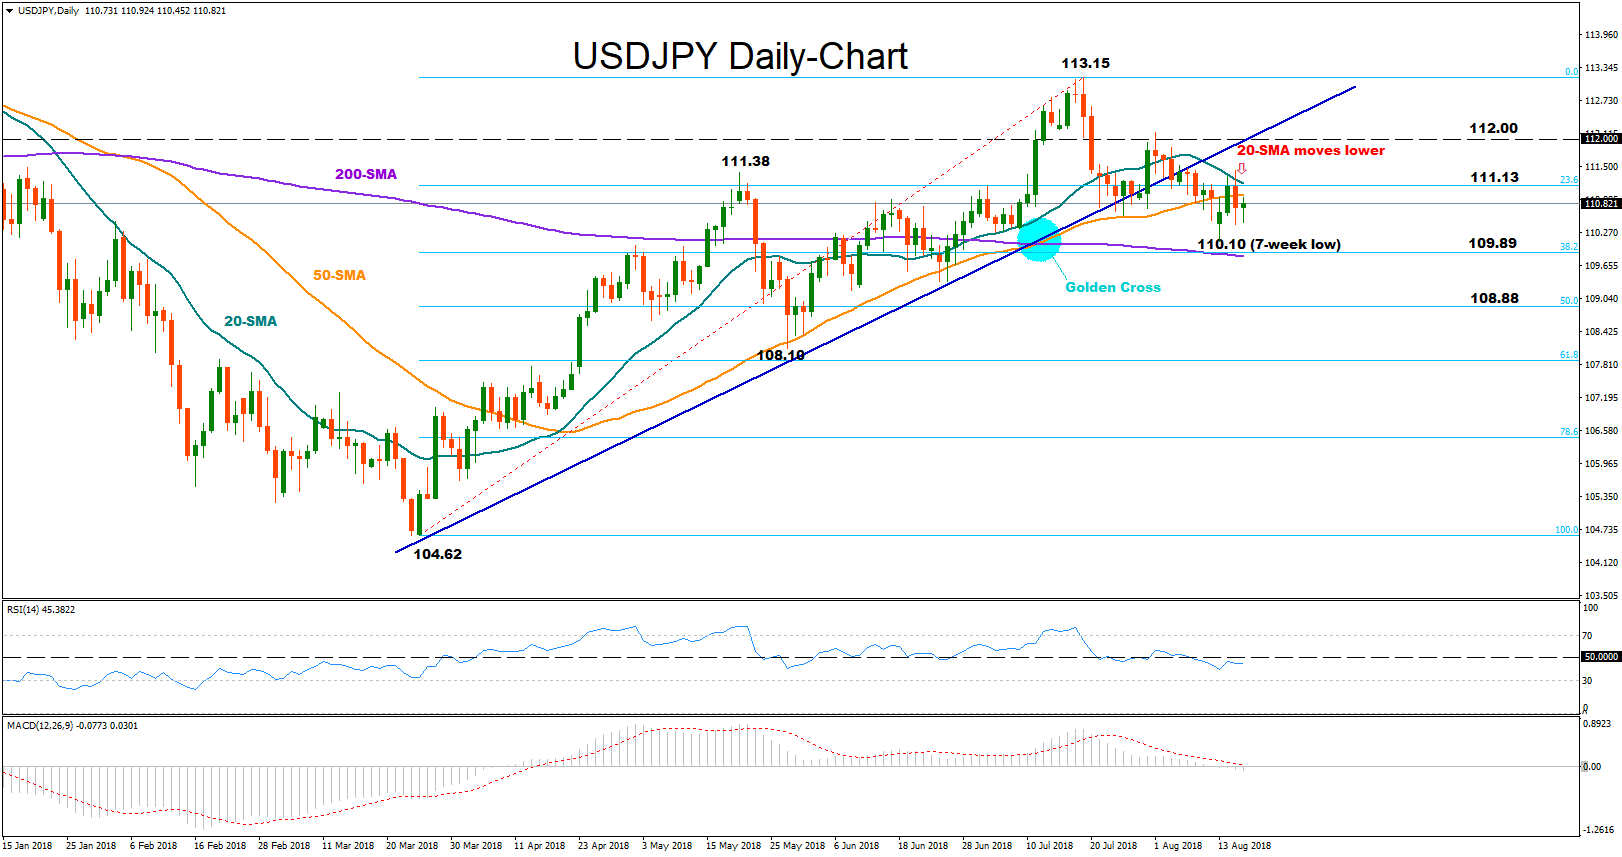
 SDJPY returned to range-bound trading after hitting an almost 7-week low of 110.10 on Monday but the negatively sloped 20-day (simple) moving average which is close to dropping below the 50-day MA may signal that the trend could develop to the downside in the short-term, especially if the bearish cross indeed materializes.
The RSI and the MACD look somewhat neutral at the moment. However, both indicators have yet to exit the bearish zone for negative risks to fade out. That is the RSI to climb above 50 and the MACD above zero and its red signal line.
Should the price reverse lower, the first target in mind could be Monday’s low of 110.10 before attention turns to the 38.2% Fibonacci retracement at 109.89 of the upleg from 104.62 to 113.15, where the 200-day MA currently moves, perhaps adding some importance to the area. Even lower, the 50% Fibonacci of 108.88 could come next into focus, while a break below May’s trough of 108.10 would more decisively confirm the start of a downtrend.
On the upside, the price could find immediate resistance between the 23.6% Fibonacci of 111.13 and May’s peak of 111.38, a frequently tested area over the past 3 weeks. Above from here, attention should be paid to the 112.00 mark as any substantial move above this level would resume the upward pattern started from 104.62 on March and at the same time signal further bullish actions. In this case, bulls could try to overcome the 113.15 top.
As regards the long-term picture, this remains mostly bullish, with the golden cross between the 50- and the 200-day MA acting as a sign that the market is more likely to maintain its positive mood in the longer timeframe.
Origin: XM


