 GBPUSD eases slightly to the upside after the aggressive falling mode posted in the preceding five weeks. The cable recorded an almost 13-month low of 1.2722 and the rally brought the price below the 20- and 40-simple moving averages (SMAs) and near the lower Bollinger Band in the daily timeframe. However, the technical indicators are suggesting for a possible upside correction.
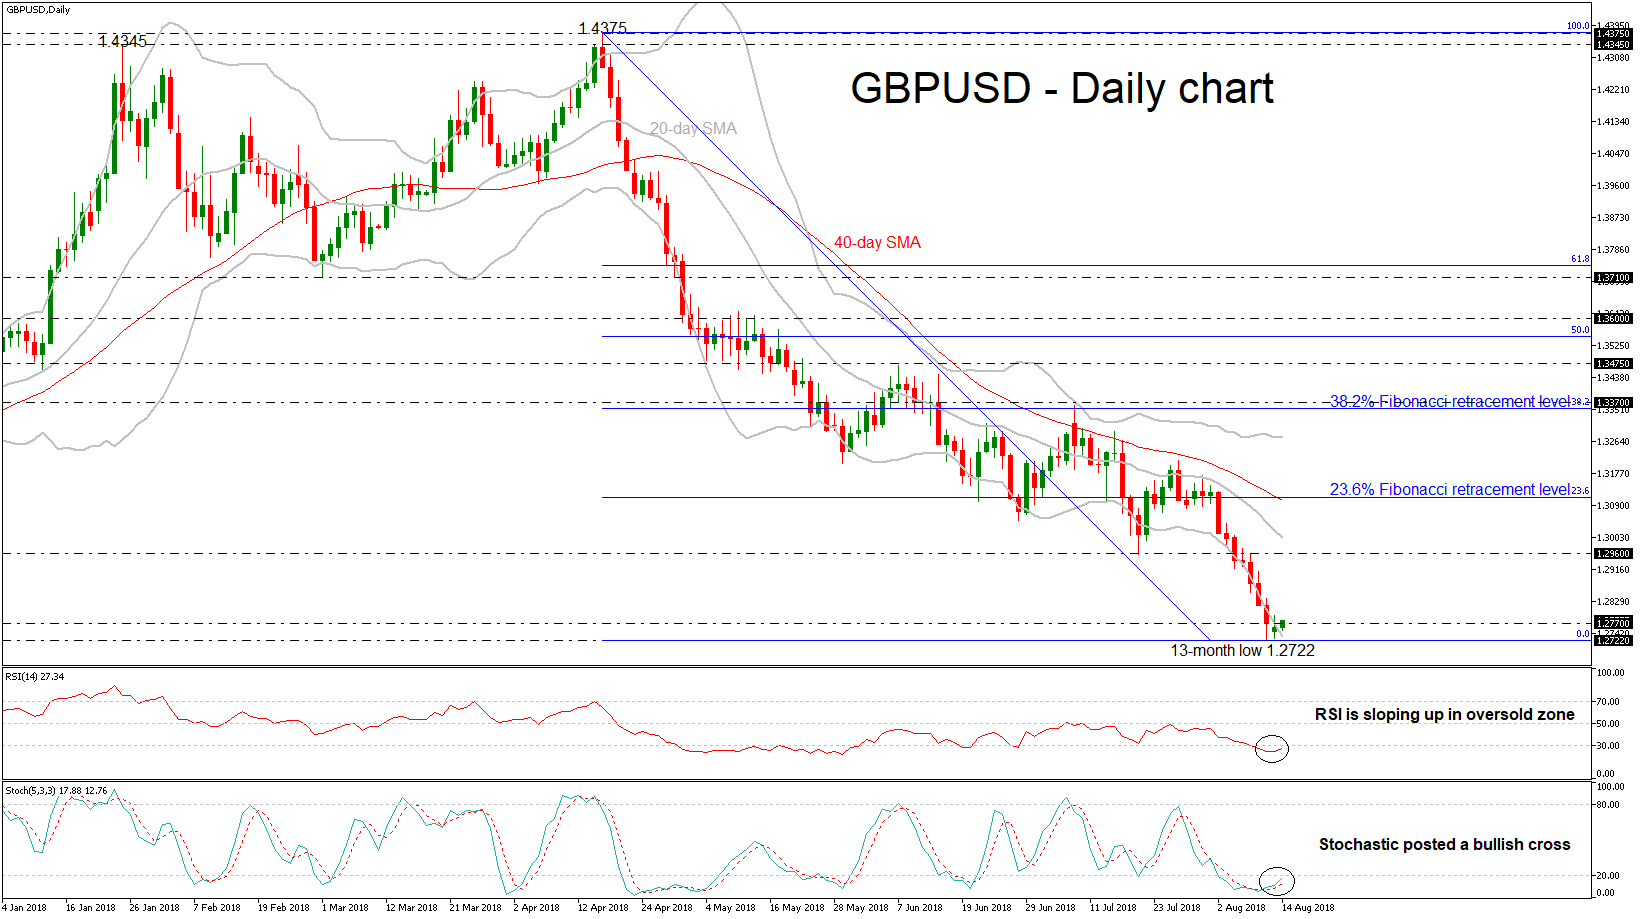
From the technical point of view, the RSI indicator is moving slightly higher but below the 30 mark in the oversold zone, while the stochastic oscillator has already created a bullish crossover within the %K and %D lines in the oversold zone, both indicating an upside movement is more likely than a downside one.
In case of an upside run, the expectation is for a move towards the 1.2960 hurdle, where a break would confirm further bullish corrections until the 23.6% Fibonacci retracement level of the downleg from 1.4375 to 1.2722, near 1.3112, which stands near the 40-day SMA.
However, a clear dip below the 1.2722 low would bring the price down to the 1.2630 support, taken from the lows on June 2017. Further losses would drive the pair towards the 1.2580 barrier.
Overall, GBPUSD continues the strong negative outlook in the medium-term, maintaining the steep downfall from the 1.4375 peak.
Origin: XM