


 USDCAD started a rally to the upside after it formed a seven-week bottom at 1.2960 on Tuesday. The price crossed above the 20-day simple moving average (SMA) and the 23.6% Fibonacci retracement level of the upleg from 1.2060 to 1.3385, around 1.3072. The technical indicators are confirming the scenario for possible further upside pressure.
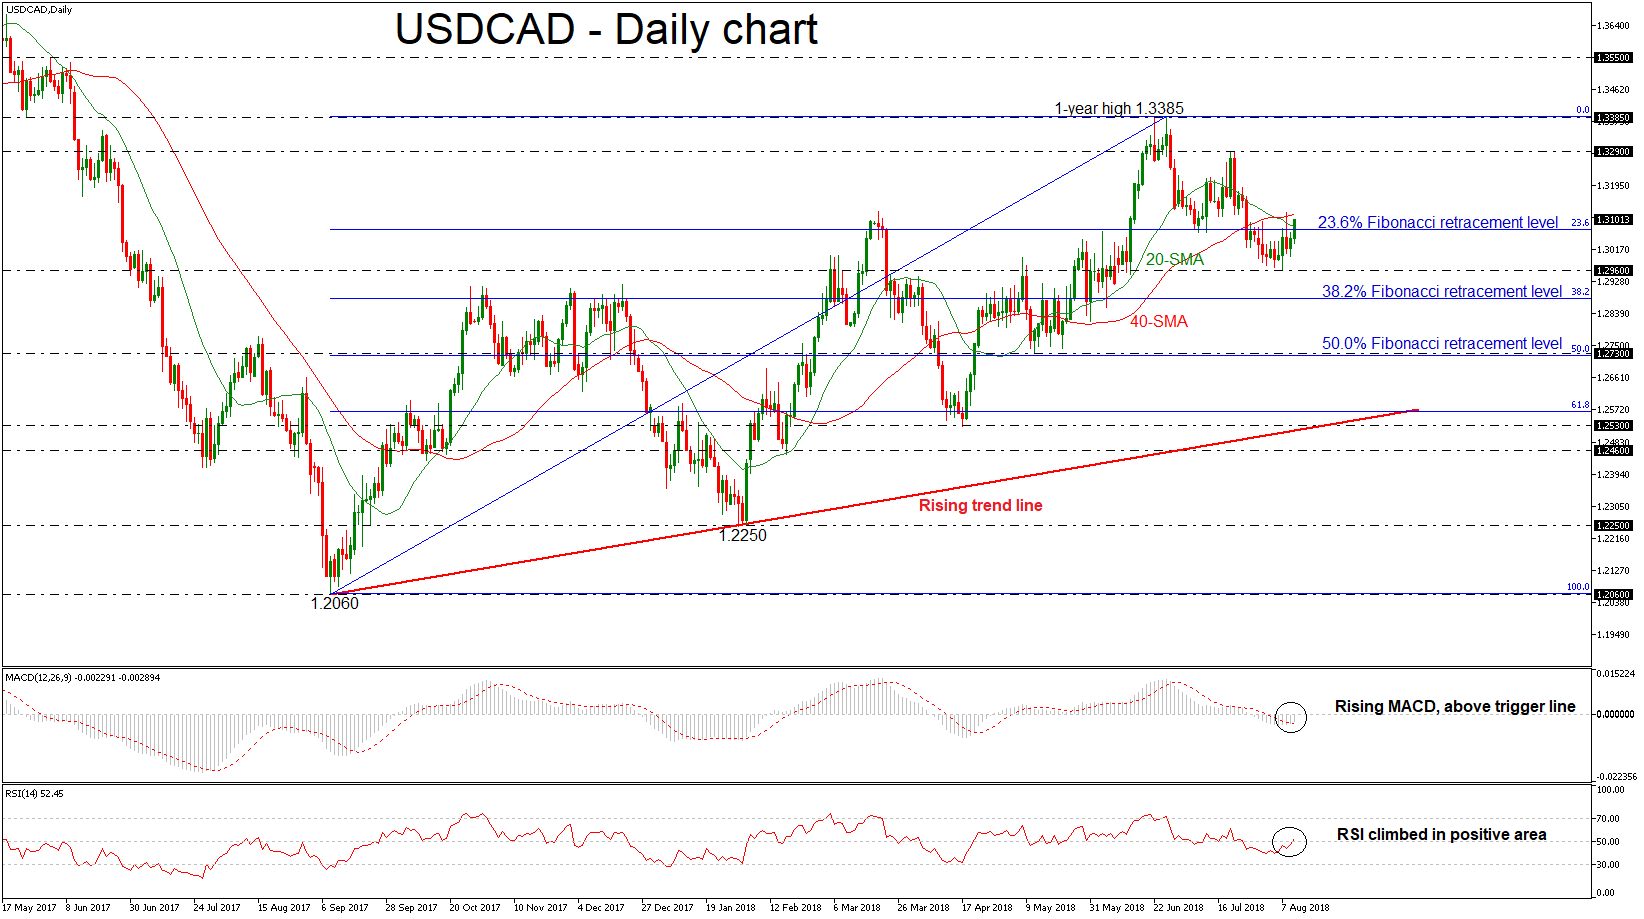
Looking at the daily timeframe, the RSI and the MACD have both strengthened, with the former rising sharply and jumping above the 50 level. The latter is heading above its red trigger line but remains below its zero line.
On the upside, the zone within the 1.3072 and 1.3117, outlined by the 23.6% Fibonacci and the 40-SMA could provide immediate resistance. Beyond this area, resistance could then run towards the 1.3290 price level, taken from the peak on July 19. A bullish rally above this hurdle could open the way for the one-year high of 1.3385.
In case of bearish extensions, traders could look for support at the 1.2690 low. Failure to hold above this level could open the door for the 38.2% Fibonacci region near 1.2880. Even lower, the area near the 50.0% Fibonacci, which stands near the 1.2730 barrier, could be another target for the bears.
Having a look at the bigger picture, dollar/loonie has been trading within an ascending movement since September 2017 and in the short-term is ready to edge higher after the bearish correction in the previous weeks.
Origin: XM


