


 4 hour
The USD/JPY made a bearish reversal after hitting the -27.2% Fibonacci target at 113.23 and breaking the rising wedge chart pattern. Price is now showing strong bearish momentum which could indicate that the wave Y corrections have been completed and a new bearish swing is starting via a potential wave A (red). The next support trend line (blue) is visible around 111.
1 hour
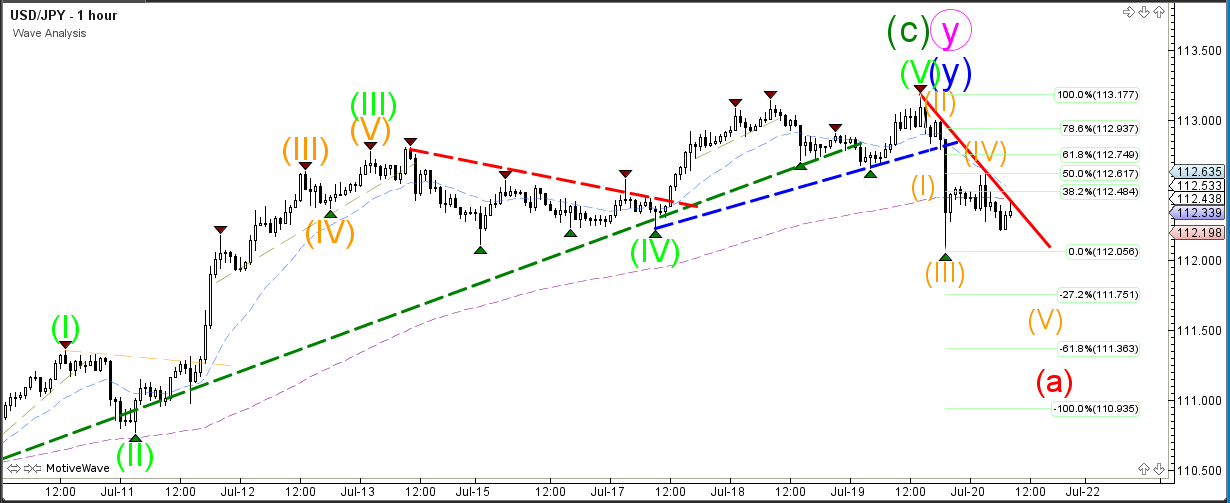
The USD/JPY could be creating a 5 wave pattern within wave A (red) but only if price does not retrace above the 61.8% Fibonacci retracement level. A break below the support trend line (blue) could indicate a bearish breakout and continuation for wave 5 (orange).
4 hour

1 hour
Origin: Admiral Markets


