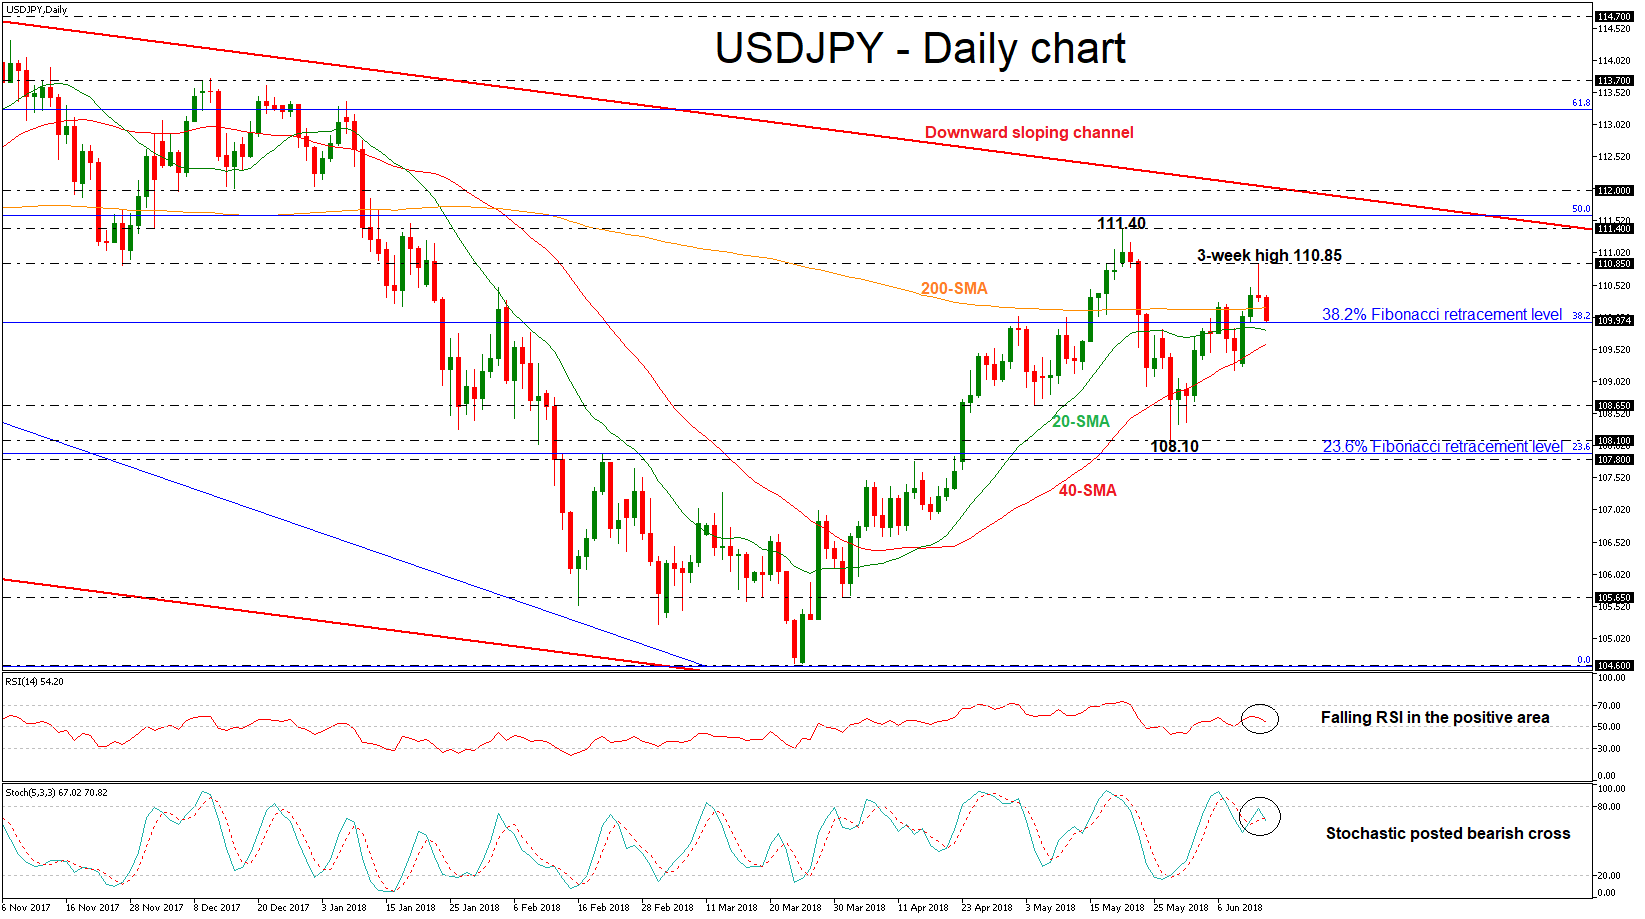
 USDJPY has come under renewed selling pressure today, falling below the three-week high of 110.85, achieved during Wednesday’s US session. The price failed to end the previous candle in green and fell once again below the 200-day simple moving average (SMA) in the near term.
Looking at momentum oscillators on the daily chart though, they suggest further declines may be on the cards in the short-term. The RSI is above its neutral 50 line, detecting negative momentum, and is also pointing downwards. The %K line of the stochastic oscillator posted a bearish cross with the %D line, suggesting further losses are nearing. Additionally, the 20-day SMA is turning slightly lower approaching the 40-day SMA for a negative cross in the next few days.
Should the pair manage to strengthen its negative momentum, and fall below the moving averages and the 38.2% Fibonacci retracement level of 109.90 of the downleg from 118.60 to 104.60, the next support could come around the 108.65. This area has been a strong obstacle in the past as the price failed to have a closing day below it in the last one-and-a-half month. A break below 108.65 would shift the short-term bias to a more bearish one and open the way towards the 108.10 mark. Below this level, the next target could come in the 107.80 – 107.90 region. The latter level is the 23.6% Fibonacci region.
However, if the prices are unable to dive below the 38.2% Fibonacci, the risk would shift back to the upside in the near-term with the 110.85 resistance coming into focus. A jump above this zone would signal a resumption of the latest uptrend that’s has been developing since the rebound on the 104.60 support. The next key resistance to watch is the 111.40 barrier.
Broadly, USDJPY has been trading within a downward sloping channel since December 2016, with a break outside it likely to determine the next trend direction.
Origin: XM