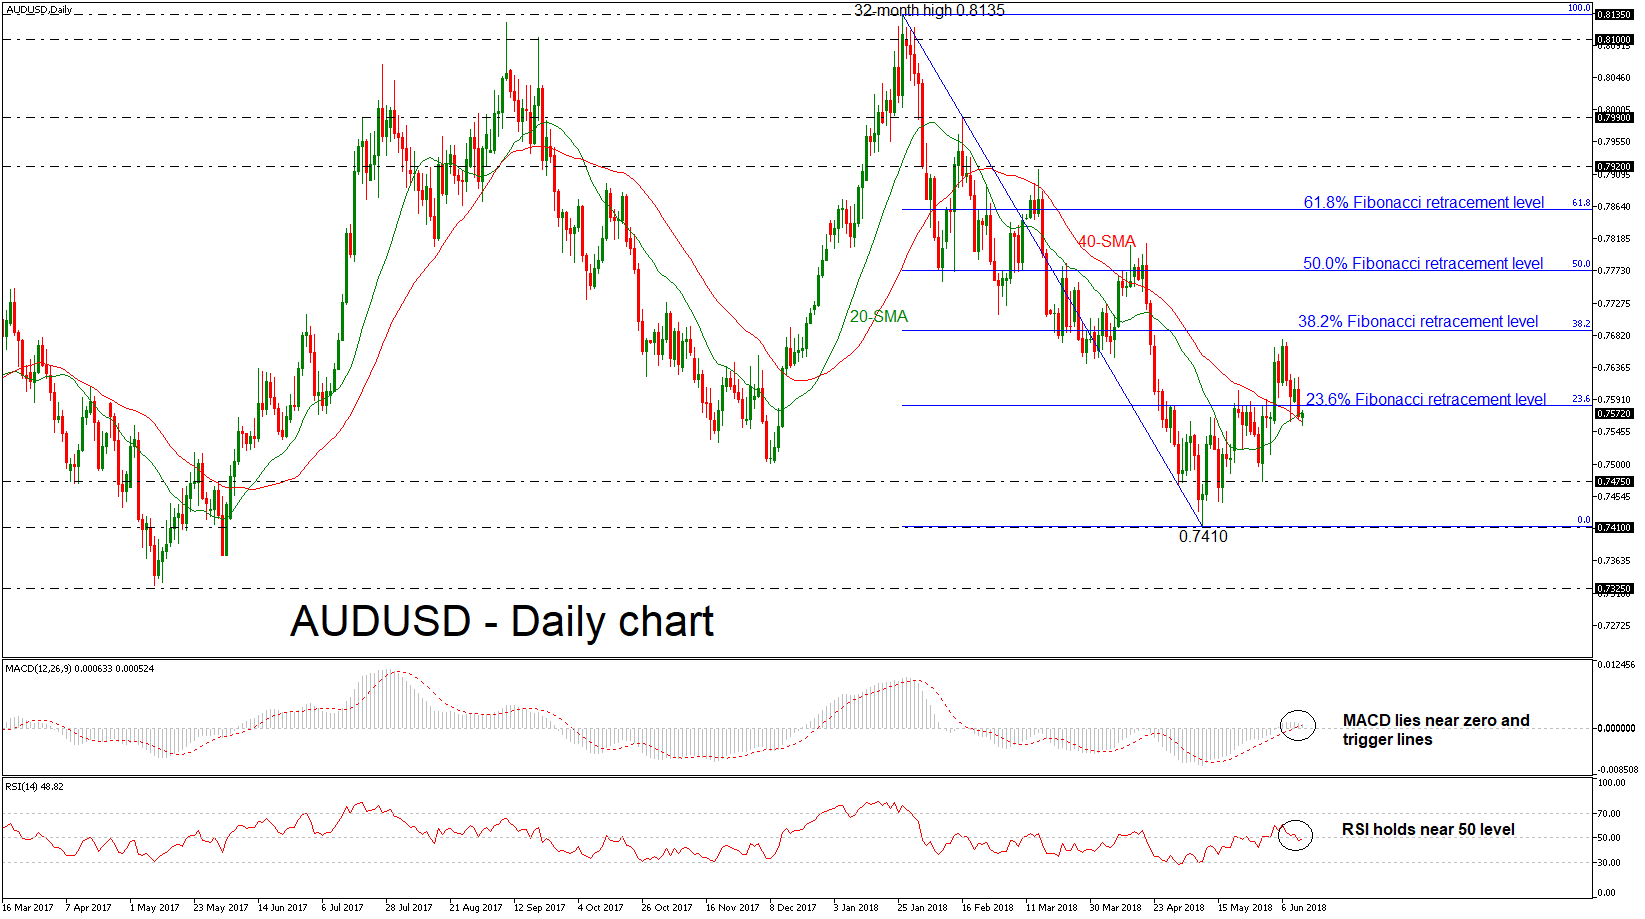
 AUDUSD is looking more bearish again as it had a failed attempt to surpass the 38.2% Fibonacci retracement level of the downleg from 0.8135 to 0.7410, around 0.7690 in the prior week. Currently, the price is developing below the 23.6% Fibonacci of 0.7580 and within the 20- and 40-simple moving averages (SMAs) in the daily timeframe.
Looking at momentum oscillators in the short-term timeframe though, they suggest neutral to bearish momentum, suggesting further downside movement may be on the cards. The RSI indicator lies slightly below its neutral 50 line, detecting negative momentum. The MACD oscillator, already negative, holds below its trigger line and near its zero lines.
If the bears continue to control the market, price declines may stall initially near the latest lows of 0.7475. A potential downside violation of this region would send prices until the 0.7410 support barrier, raising the likelihood of more downside pressure. In such a case, the 0.7325 level could act as a barrier to the downside, identified by the May 9 low.
On the other side, in case of a bullish run above the 23.6% Fibonacci in the pair, immediate resistance may be found near the 38.2% Fibonacci of 0.7690. An upside break of that zone would open the way for the 50.0% Fibonacci of 0.7770. If buyers manage to push above that hurdle too, that would drive the price towards the 61.8% Fibonacci level near 0.7860.
In the medium-term, the outlook is also negative following the aggressive bearish rally after the bounce off the 32-month high of 0.8135 at the end of January.
Origin: XM