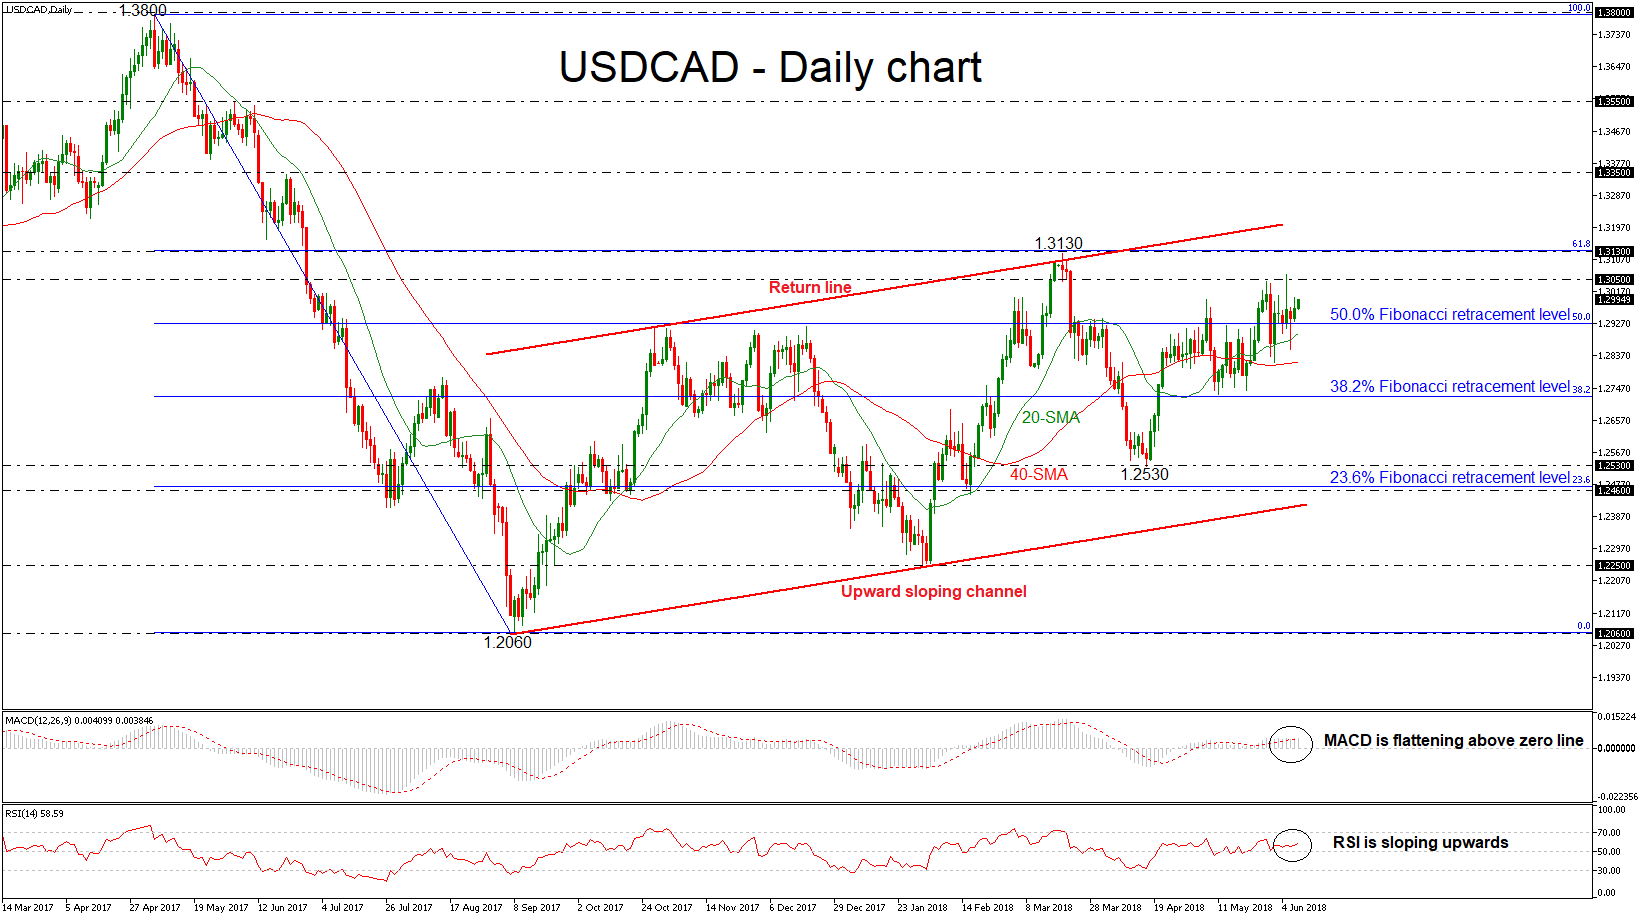
USDCAD is still holding above the simple moving averages in the daily timeframe over the last couple of weeks signaling that the pair is ready for more bullish extension. Also, the price remains above the 50% Fibonacci retracement level of the downleg from 1.3800 to 1.2060, around 1.2925 and challenged several times the 1.3050 resistance level in the past, which is acting as strong resistance level.
Looking at the short-term chart, based on technical indicators, momentum is too weak to provide a sustained move higher. The MACD oscillator is flattening near its trigger line in the positive area, while the RSI indicator is standing above the 50 threshold but is sloping slightly upwards.
In case of an upward attempt, the 1.3050 resistance level could act as a significant barrier before being able to re-challenge the 1.3130 obstacle, which overlaps with the 61.8% Fibonacci mark. A climb above this region would send prices above the upward sloping channel towards the 1.3350 hurdle, which would suggest a stronger bullish structure.
Conversely, the next support should come from the 20- and 40-simple moving averages (SMAs) near 1.2900 and 1.2820 respectively. A dip below this region would drive the price towards the next barrier of the 38.2% Fibonacci, around 1.2725. Further losses could send the pair until the next low of 1.2530, taken from the trough on April 17 and significantly weaken the bullish medium-term picture.
Having a look at the bigger picture, USDCAD has been trading within an ascending sloping channel since September 2017, failing several times to exit from this range.
Origin: XM