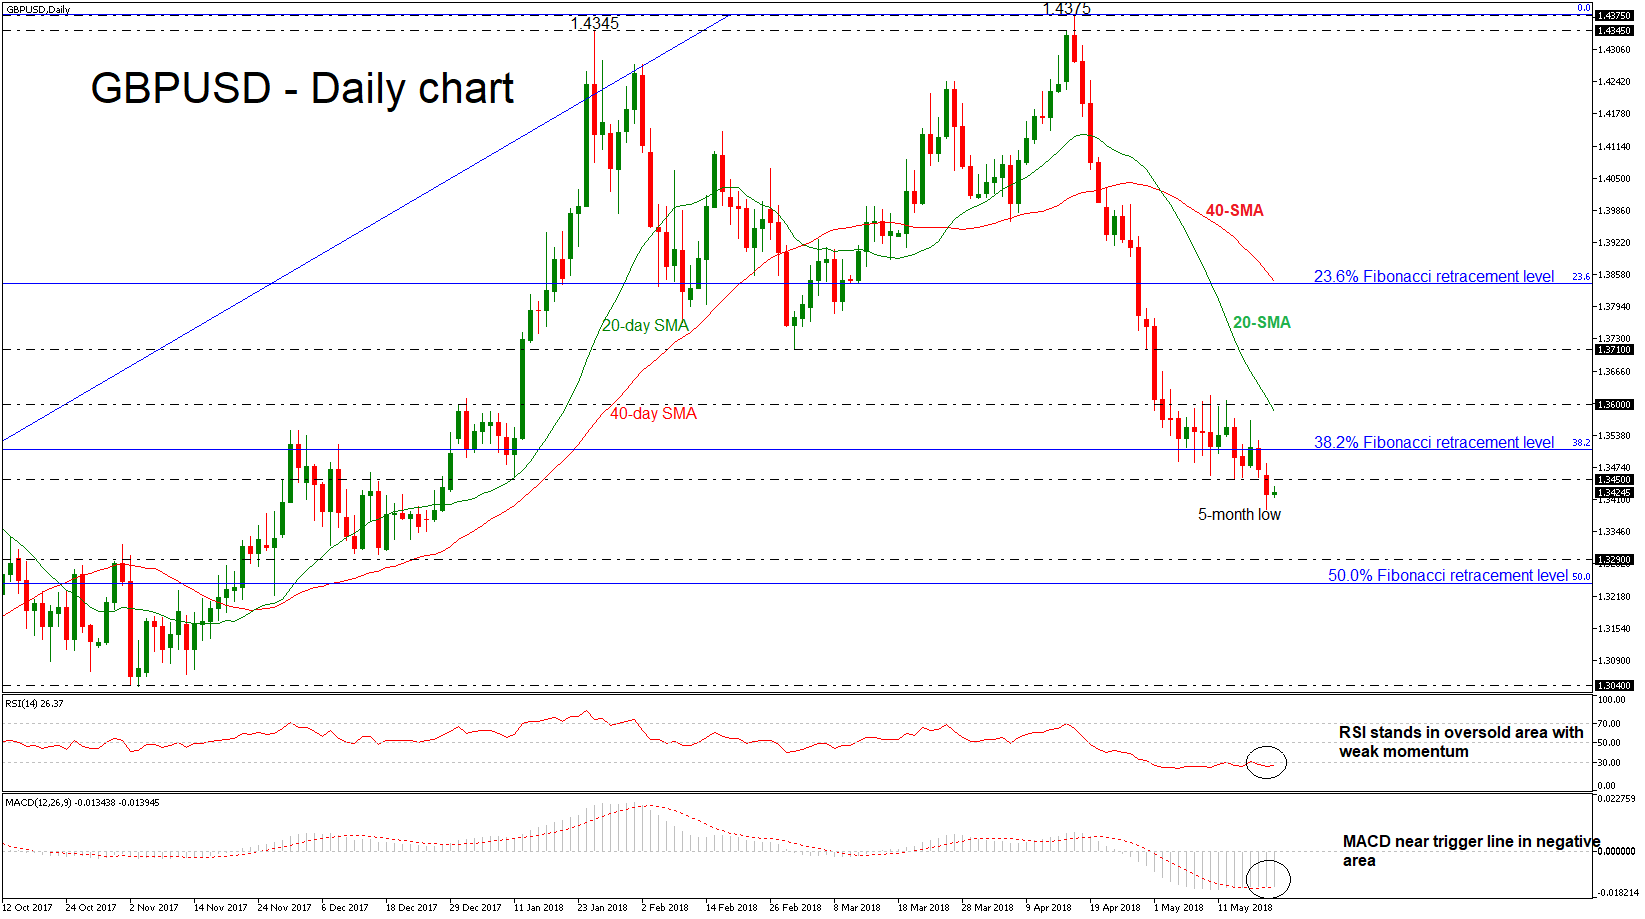
 GBPUSD had a deep fall during Monday’s trading period as it dropped below the narrow range of 1.3450 to 1.3600, which had been holding over the previous two weeks. The price plunged to a new five-month low of 1.3389, however, price action is at the moment taking place not far above this trough.
In the daily timeframe based on technical indicators, momentum is too weak to provide a sustained move higher. The RSI indicator is flattening in the oversold level near the 30 barrier, while the MACD oscillator is trying to jump above its trigger line to create a bullish cross in the negative territory.
If price action remains below the 1.3450 strong resistance level, there is scope to test the 1.3290 support level. Clearing this key level would see additional losses towards the next barrier of the 50.0% Fibonacci retracement level of the upleg from 1.2100 to 1.4345, around 1.3240. A fall below it would see prices re-testing the 1.3040 hurdle, identified by the November 2017 low.
However, if the 1.3450 resistance fails, then the focus would shift to the upside towards the 38.2% Fibonacci mark of 1.3510, which stands in the middle of the aforementioned narrow range (1.3450 – 1.3600). If this level is breached, it would increase upside pressure and challenge the 1.3600 handle, which holds near the 20-day simple moving average (SMA). Moving higher, immediate resistance could be found at 1.3710, taken from the low on March 1.
To sum up, GBPUSD has been negative since breaking below the sideways channel and is expected to remain as long as price action is taking place below 1.3450.
Origin: XM