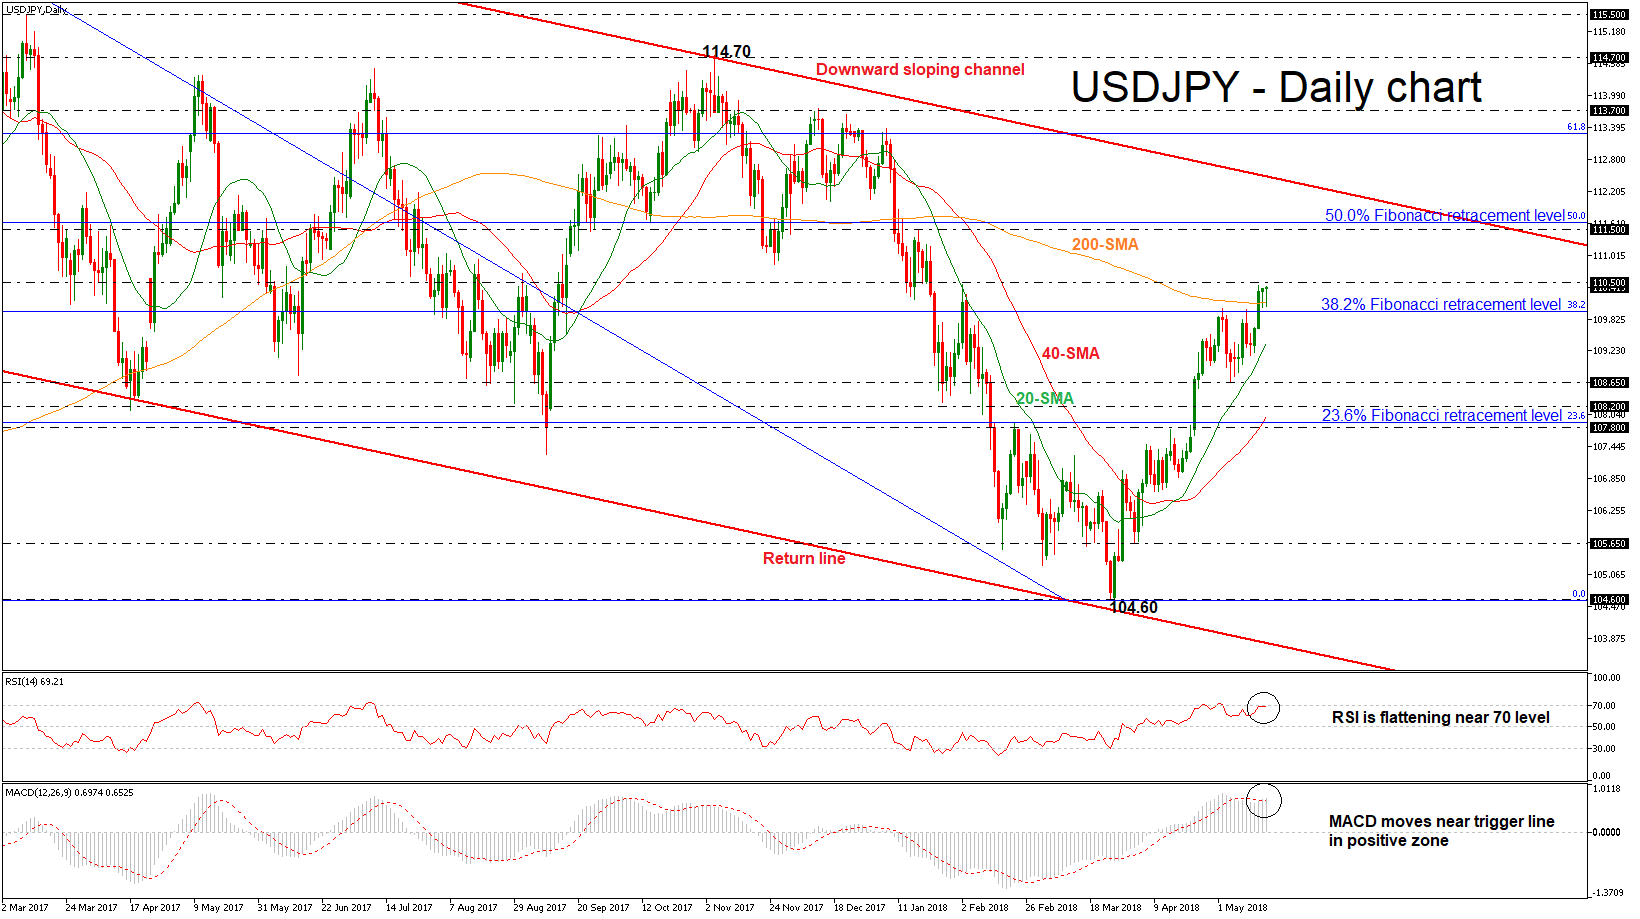
 USDJPY is moving near its opening level during today’s early European session following the aggressive buying interest of the previous three days. The pair has challenged a fresh more than three-month high of 110.44 and successfully surpassed the 200-day simple moving average (SMA). The price remains above the aforementioned obstacle however, technical indicators suggest that the market could ease a little bit in the short-term.
From the technical point of view, in the daily timeframe, the RSI indicator is flattening after reaching overbought levels, while the MACD oscillator is holding near its trigger line in the positive territory, both hinting that the next potential move in prices could be weaker than before.
If the price extends its bullish bias and climbs above the 110.50 barrier, immediate resistance could be met at the 111.50 hurdle, which stands near the 50.0% Fibonacci mark. A jump above this significant zone could send prices towards the descending trend line of the downward sloping channel near 112.00.
On the flip side, should the market create a bearish correction of the sharp bullish rally, immediate support could be found near the 38.2% Fibonacci retracement level around the 110.00 handle of the downleg from 118.60 to 104.60. A significant leg below this area could drive prices towards the 20-day SMA which currently fluctuates near 109.35 before the market retests the 108.65 support.
In the bigger picture, the pair has been developing within a channel tilted slightly to the downside since December 2016 and is now turning its focus to the upside, trying to hit the upper boundary.

Origin: XM


