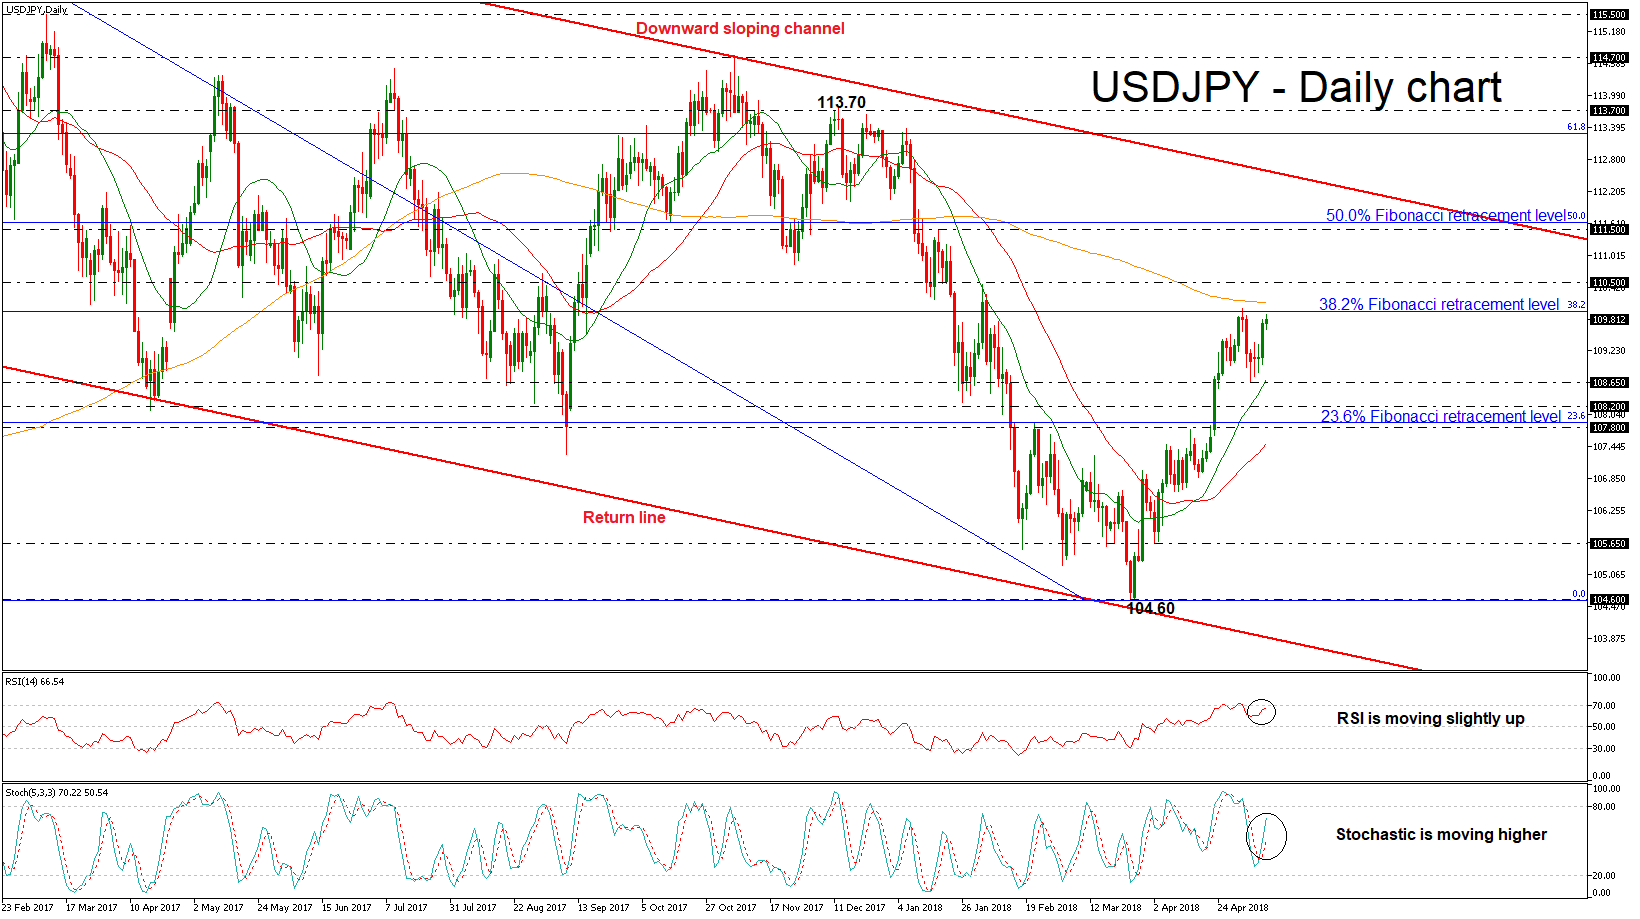
 USDJPY has posted a strong bullish run during Wednesday’s trading session and is approaching again the three-month high near the 110.00 psychological level. This region overlaps with the 38.2% Fibonacci retracement level of the downleg from 118.60 to 104.60. The technical indicators in the short-term seem to be in agreement with the bullish scenario.
From the technical point of view, the price is ready to touch the 200-day simple moving average (SMA) near 110.20, which is acting as strong resistance in the medium-term, in case of a break of 110.00, while it is developing well above the 20- and 40-SMAs in the short-term. The RSI indicator is sloping slightly up in the positive territory, while the stochastic oscillator is moving higher below its overbought region.
If the price successfully surpasses the 38.2% Fibonacci retracement level and the 200-day SMA, this could reinforce the bullish move and drive the pair until the 110.50 resistance level taken from the peak on January 18. A jump above the aforementioned obstacle could push the price further up towards 111.50, which holds near the 50.0% Fibonacci.
Conversely, in case of a bounce off the 110.00 handle, there is a possibility of bearish movement until the next immediate support of 108.65. If the price continues the downward tendency it could open the way towards the 107.80 – 108.20 significant area, which contains the 23.6% Fibonacci.
As a side note, the pair has been consolidating within a downward sloping channel since December 2016 and touched the lower boundary at the end of March, creating a 16-month low of 104.60.

Origin: XM


