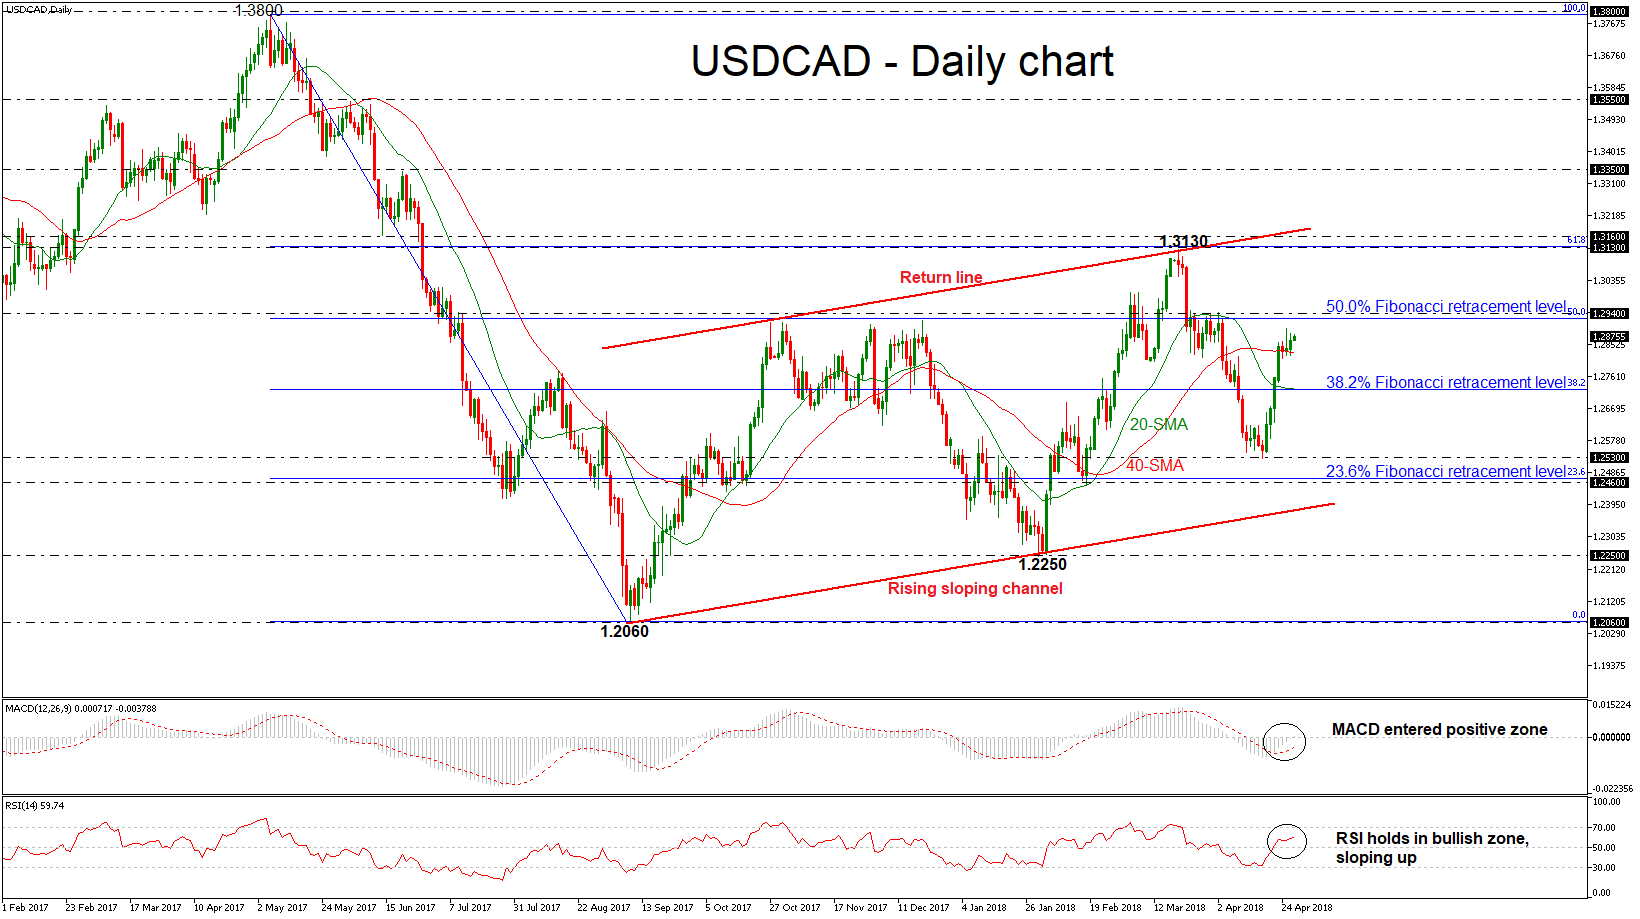
 USDCAD is ready to complete two consecutive positive weeks after the rebound on the 1.2530 support level. When looking at the bigger picture, the pair has been trading within a rising sloping channel since September 2017, failing several times to exit from this range. The technical indicators, though, continue to send bullish signals, suggesting that the bullish market is not over yet.
The MACD oscillator has crossed above the zero line, indicating that the market could strengthen a little bit more in the short-term. The Relative Strength Index (RSI) is standing in the positive area and is pointing to the upside supporting a bullish picture as well. As a side note, the price successfully surpassed above the simple moving averages and the 38.2% Fibonacci retracement level around 1.2720 of the downleg from 1.3800 to 1.2060.
Should the pair manage to strengthen its positive momentum, the next resistance could come around the 50.0% Fibonacci level slightly below the 1.2940 strong resistance level. A break above this level would endorse the bullish bias and open the way towards the 1.3130 – 1.3160 resistance zone, which stands near the return line of the upward sloping channel.
In case of declines in the pair, immediate support may be found near the 38.2% Fibonacci of 1.2720, which coincides with the 20-day simple moving average (SMA). A downside break of this zone would open the way towards the 1.2530 support barrier. If sellers manage to push below that hurdle too, that would drive the price until the 23.6% Fibonacci neat 1.2460.
Origin: XM