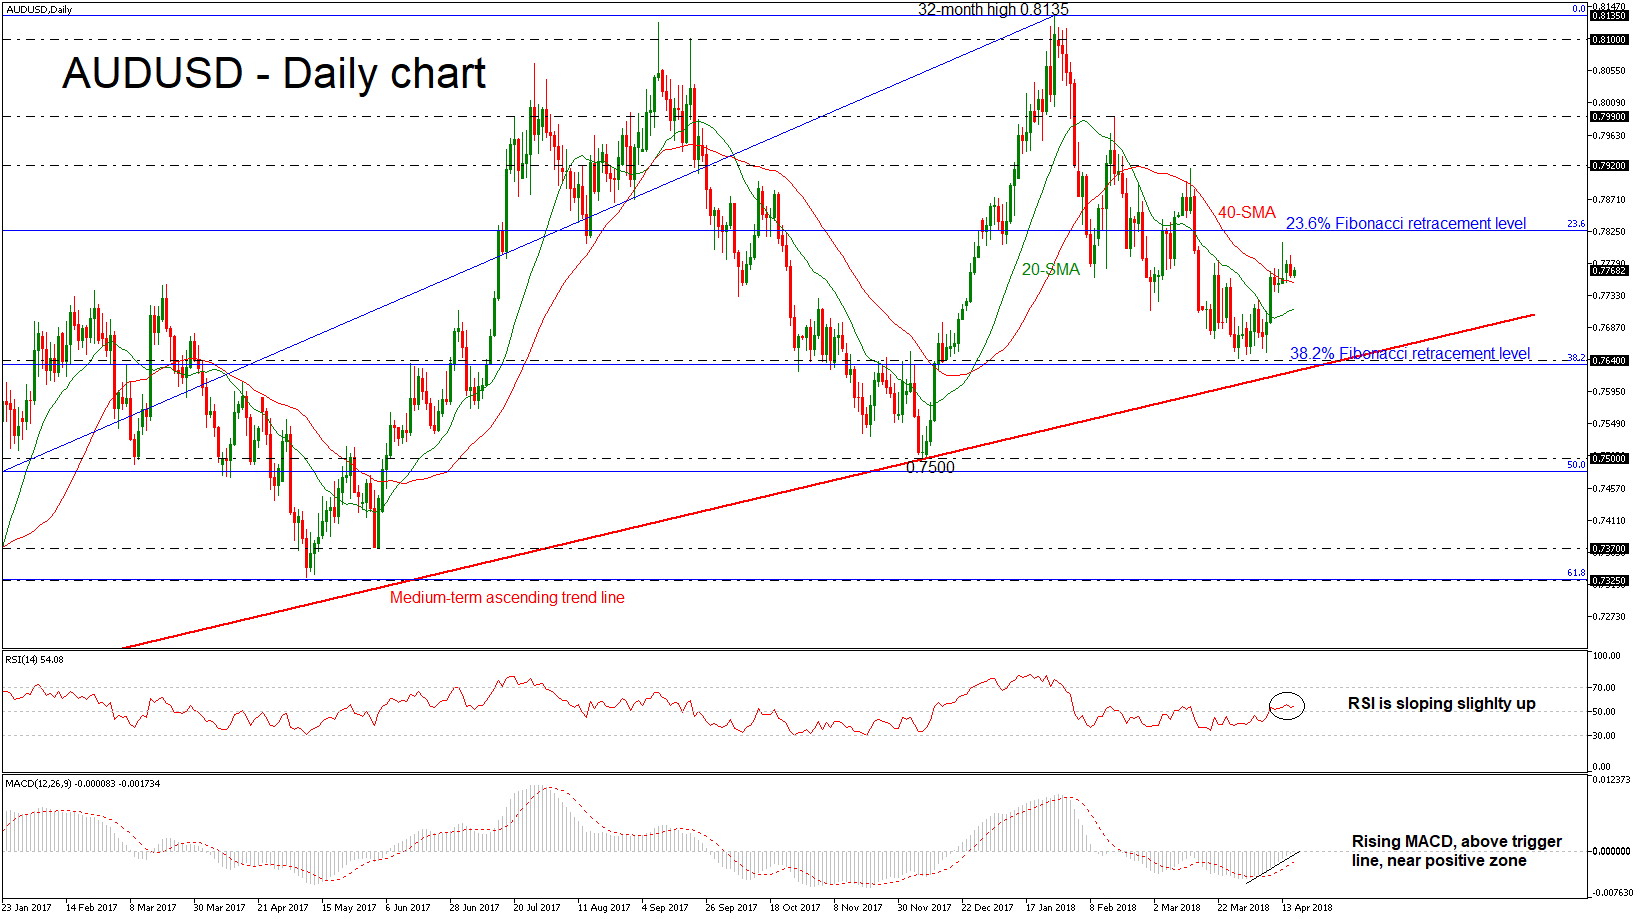
 Since its deep fall towards the 0.7640 support level at the end of March, AUDUSD has been developing between the 38.2% Fibonacci retracement level of 0.7635 and the 23.6% Fibonacci mark of 0.7825. The Fibonacci levels are taken from the upleg of the last big upward movement in the weekly timeframe, with the low of 0.6820 and the high of 0.8135.
Last week the pair snapped the four losing weekly sessions and posted a positive candle, while the 50-week simple moving average (SMA) recorded a bullish cross with the 200-week SMA, suggesting a buying interest. In the near-term, the moving averages are sloping to the upside and the price is holding above them.
Looking at momentum indicators, the RSI is standing above the threshold of 50 and is moving north, while the MACD oscillator is rising in the negative zone but is approaching the positive territory.
If prices continue to head higher, immediate resistance could come from the 23.6% Fibonacci. A jump above this level would reinforce the short-term bullish view and open the way towards the 0.7920 resistance barrier.
However, should a downside reversal take from, the next support to have in mind is the 38.2% Fibonacci. In case of a penetration of this area, the strong bullish movement could shift to bearish, as the price would break the medium-term ascending trend line as well. The next support is coming from the 0.7500 handle, taken from the low on December 2017.
Origin: XM