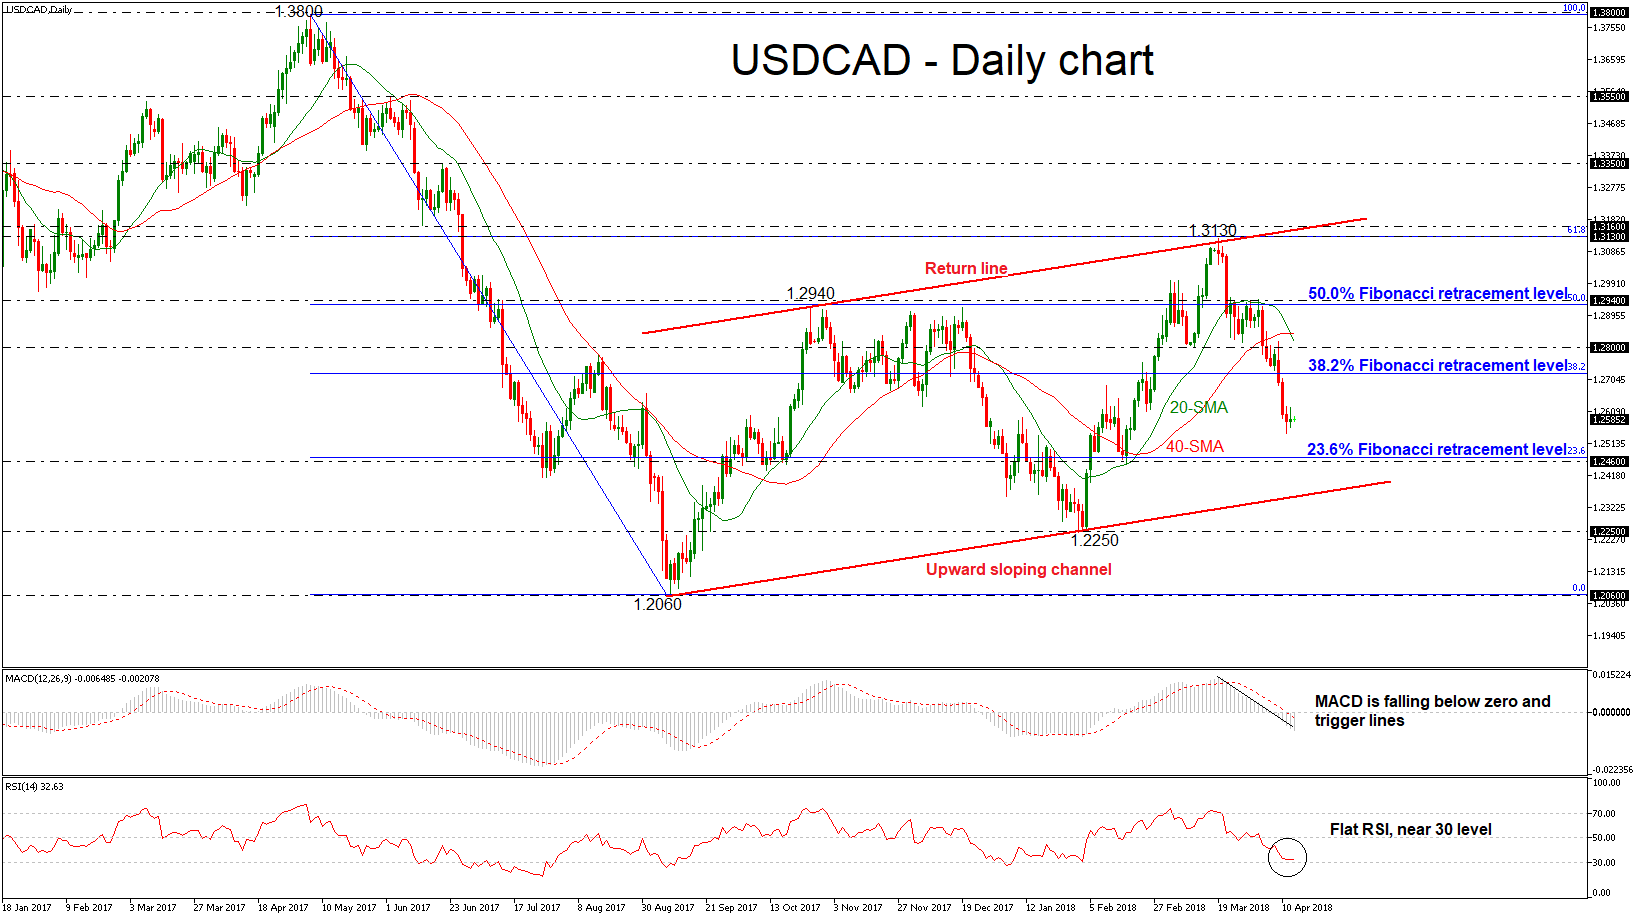
 USDCAD has been posting an aggressive downside rollercoaster since the previous weekly session, failing to climb above the 50.0% Fibonacci retracement level around 1.2940 of the downleg from the high of 1.3800 to the low of 1.2060. It is worth mentioning that the pair has been developing within an upward sloping channel over the last seven months.
Prices have reversed sharply lower and momentum indicators remain in bearish territory, suggesting fresh losses as the immediate risk is to the downside. The MACD oscillator is falling below the trigger line and is standing well below the zero line. However, the RSI indicator is flattening near the oversold area, losing its strong negative momentum. The 20-day simple moving average (SMA) completed a bearish cross with the 40-day SMA, signaling further declines.
Should the pair manage to strengthen its negative momentum, the next support could come around 23.6% Fibonacci mark near the 1.2460 barrier. A break below the aforementioned hurdle could open the way towards the next key support, touching the ascending trend line around the 1.2400 psychological level.
However, should an upside reversal take form, immediate resistance will likely come from the 38.2% Fibonacci level of 1.2720, followed by the 1.2800 handle. A bullish run above these levels and the bearish cross within the SMAs, could shift the bias back to bullish one with the next resistance coming from the 1.2940 strong obstacle.