


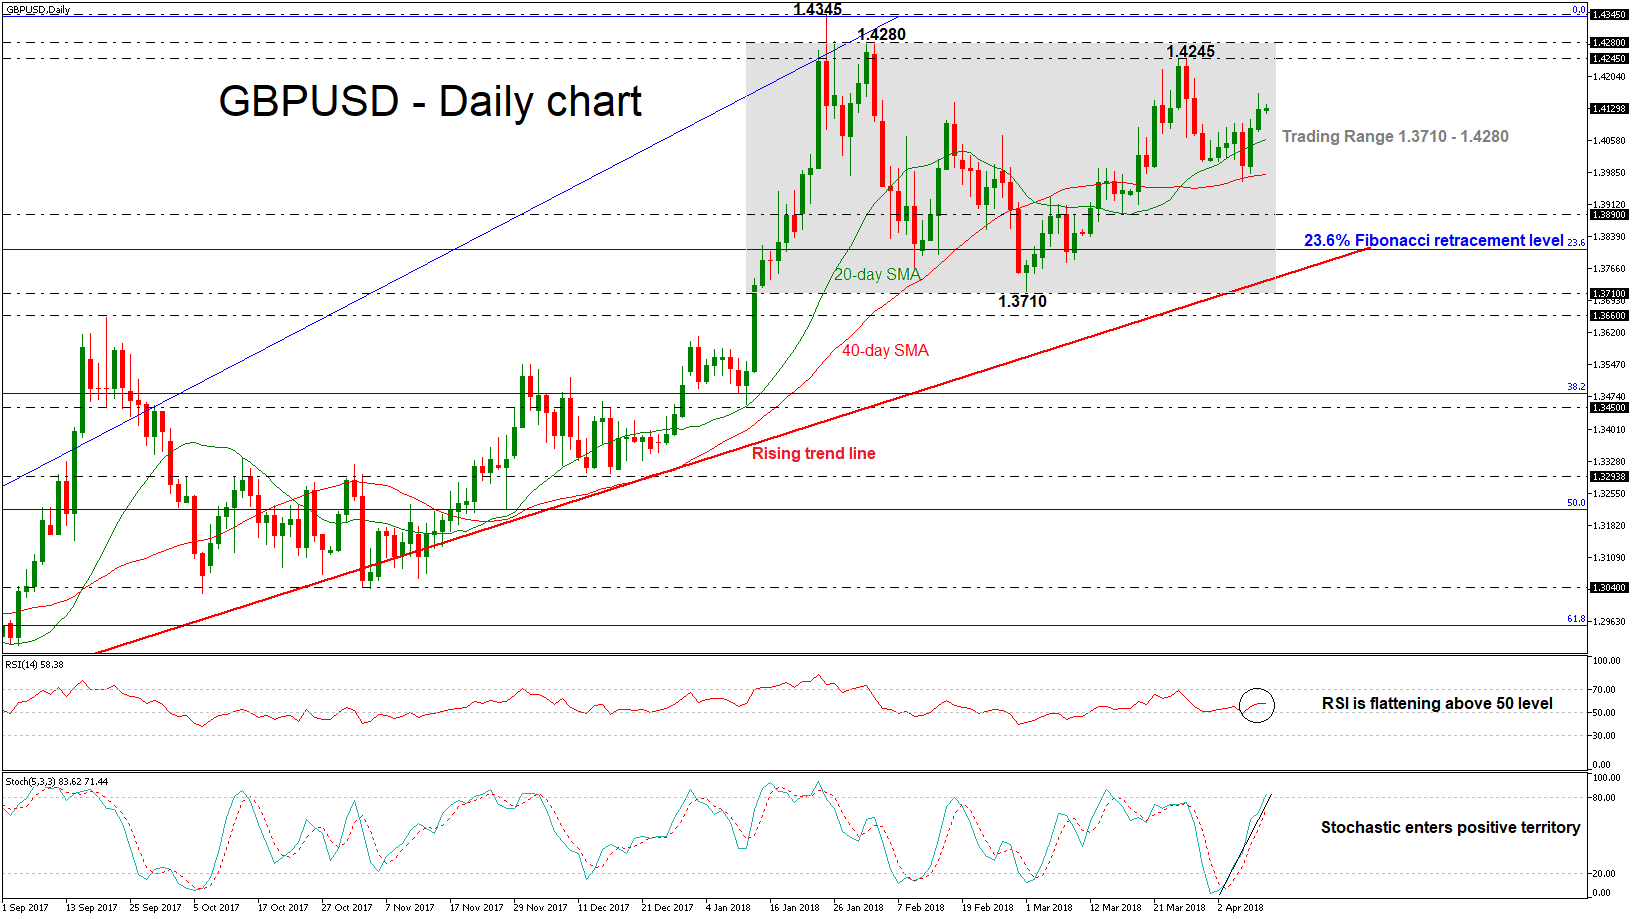
 GBPUSD has been consolidating since January 12 with upper boundary the 1.4280 resistance level and lower boundary the 1.3710 support barrier. The neutral to bullish picture in the short-term looks to last a while longer as prices are still trading in the middle of the trading range. During a previous couple of sessions, the pair rebounded on the 40-day simple moving average and is trying to extend its gains to the upside.
Support was met around the 1.3980 region, forcing the cable to reverse higher. The positive bias in the near-term is supported by the deterioration in the momentum indicators. The %K line of the stochastic oscillator has risen sharply into overbought levels and the %D line is following it. However, the RSI indicator is flattening in the bullish territory, suggesting a continuation of the sideways channel.
If prices continue to head higher, resistance should come from the 1.4245 – 1.4280 area. A jump above this zone would reinforce the medium-term bullish view and open the way towards 1.4345, which has been a major resistance area in the past.
On the flip side, should a downside reversal take form, immediate support could likely come from the 20 and 40 SMAs, near 1.4060 and 1.3980 respectively. A break below the latter level could shift the short-term bias to a bearish one, with the next support coming from 1.3890. Further losses, could drive the pair towards the 23.6% Fibonacci retracement level around 1.3810 of the upleg from 1.2100 to 1.4345.
As a side note, the aforementioned obstacle stands near the ascending trend line, which has been holding since March 2017 and in case of a break below it, could shift the medium-term bullish outlook to negative.
Origin: XM


