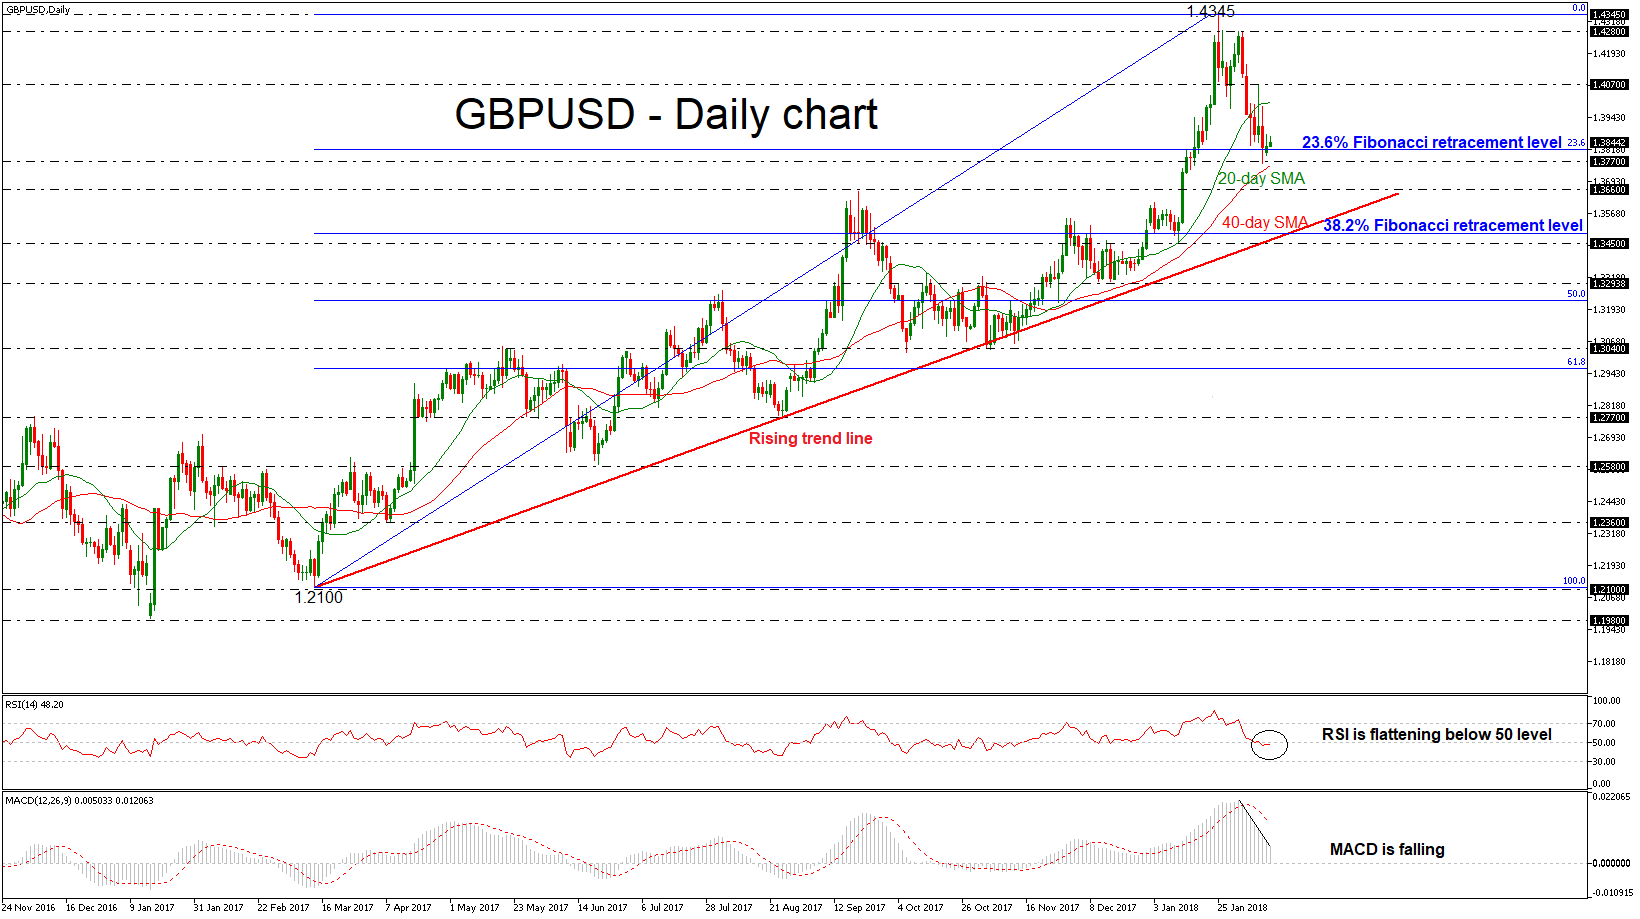
 GBPUSD fell as low as 1.3770, a level that has been standing near the 40-day simple moving average during the past week. Since yesterday, the price has been trading slightly higher and successfully surpassed the 23.6% Fibonacci retracement level near 1.3820 of the last upward movement with the low of 1.2100 and the high of 1.4345.
Looking at the daily timeframe, the aggressive sell-off started after the pullback on the 1.4280 strong resistance level and the bearish correction is still in progress. The Relative Strength Index (RSI) is holding in the negative zone and is flattening, while the MACD oscillator is falling below its trigger line in the bullish territory.
Remaining in the same timeframe, if price continues the downside retracement and extends its losses below the 1.3770 support level, it could open the door for the 1.3660 barrier. If there is a fall below the latter level, there would be scope to test the 38.2% Fibonacci mark of 1.3490, which is near to the 11-month ascending trend line.
To the upside, the cable it could move towards the 1.4000 handle, which overlaps with the 20-day SMA at the time of writing. A break above the aforementioned obstacle could take the price towards the 1.4070 resistance level.
Origin: XM