


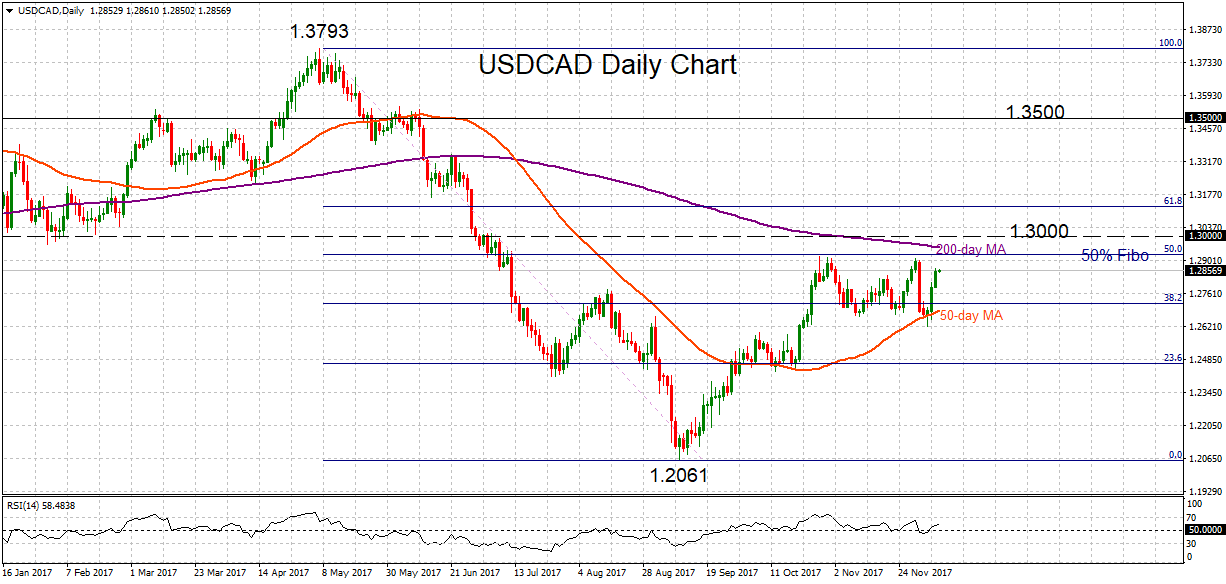
 USDCAD is rising back to the upper end of its range that has been forming since late October. Momentum strength is relatively weak as can be seen by the RSI. The short-term neutral phase is expected to continue as long as the pair is capped by the 200-day moving average.
USDCAD has been unable to make a sustained break through the 50% Fibonacci retracement level (1.2922) of the downtrend from 1.3793 to 1.2061 and has been trading below this level since July. Strong upside momentum is needed for a successful extension above what is a strong resistance zone comprised of the 50% Fibonacci, the 200-day MA and the key psychological 1.3000 level. Such a move would open the way towards 1.3500 and then re-test the 1.3793 peak.
Dips are expected to find good support near the 38.2% Fibonacci (1.2718) and the 50-day MA (1.2685). A break below this area would increase downside pressure and send prices towards the 1.2500 handle and possibly the 1.2061 low.
USDCAD needs a catalyst to push above the range from late October but momentum is weak at the moment. Meanwhile, the underlying downtrend from 1.3793 has not shown any signs of reversing yet as long as the market remains below its 200-day MA, which is keeping the overall bearish outlook.
Origin: XM


