


 USDCAD is consolidating its gains made after a bounce to the October 27 high of 1.2916. Momentum indicators are relatively neutral.
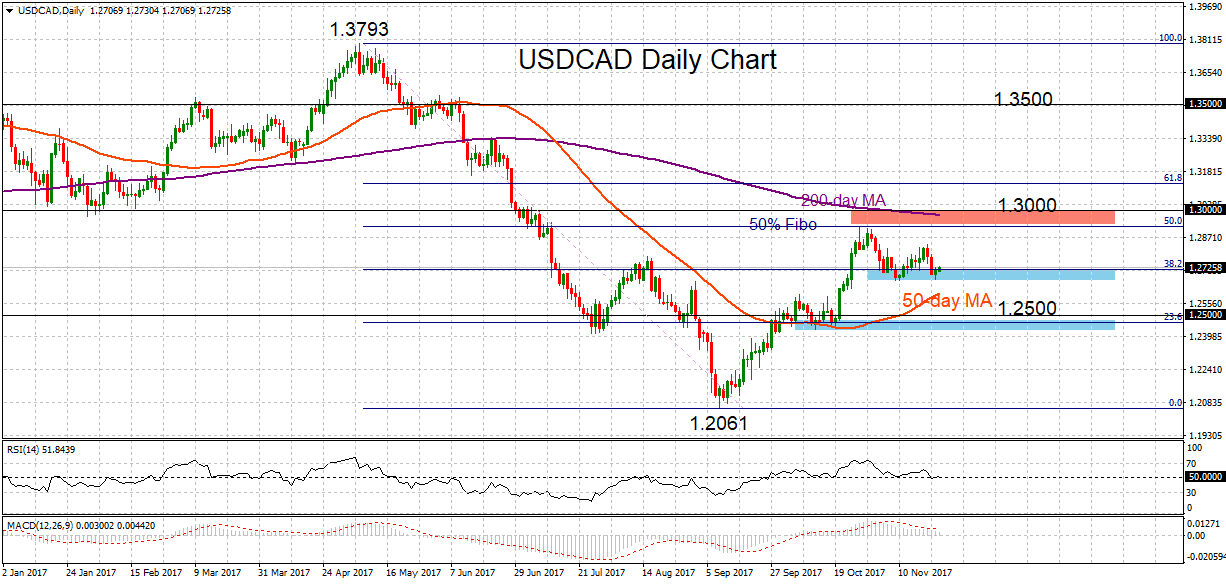
The rally off the 6-month low of 1.2061 from September to October has lost steam after finding strong resistance at the 50% Fibonacci retracement level (1.2922) of the downleg from medium-term downtrend from 1.3793 to 1.2061.
The market is now at risk of reversing the recent corrective move. Prices are currently testing the 38.2% Fibonacci retracement level and there is a support zone between this level at 1.2715 and 1.2667. A breakdown of this support area would push USDCAD another leg lower to another key support zone between 1.2500 and 1.2432. An extension lower would open the way for a re-test of the 1.2061 low and from here there would be a resumption of the medium-term downtrend.
To the upside, there is a strong resistance zone between the 50% Fibonacci retracement level (1.2922) and the key psychological 1.3000 level. The 200-day moving average is also in this zone, making it a challenge for the market to break above.
As long as the market remains below its 200-day MA, the overall bearish outlook remains in play. A rise above the 50% Fibonacci is needed to weaken downside pressure.
Origin: XM


