 4 hour
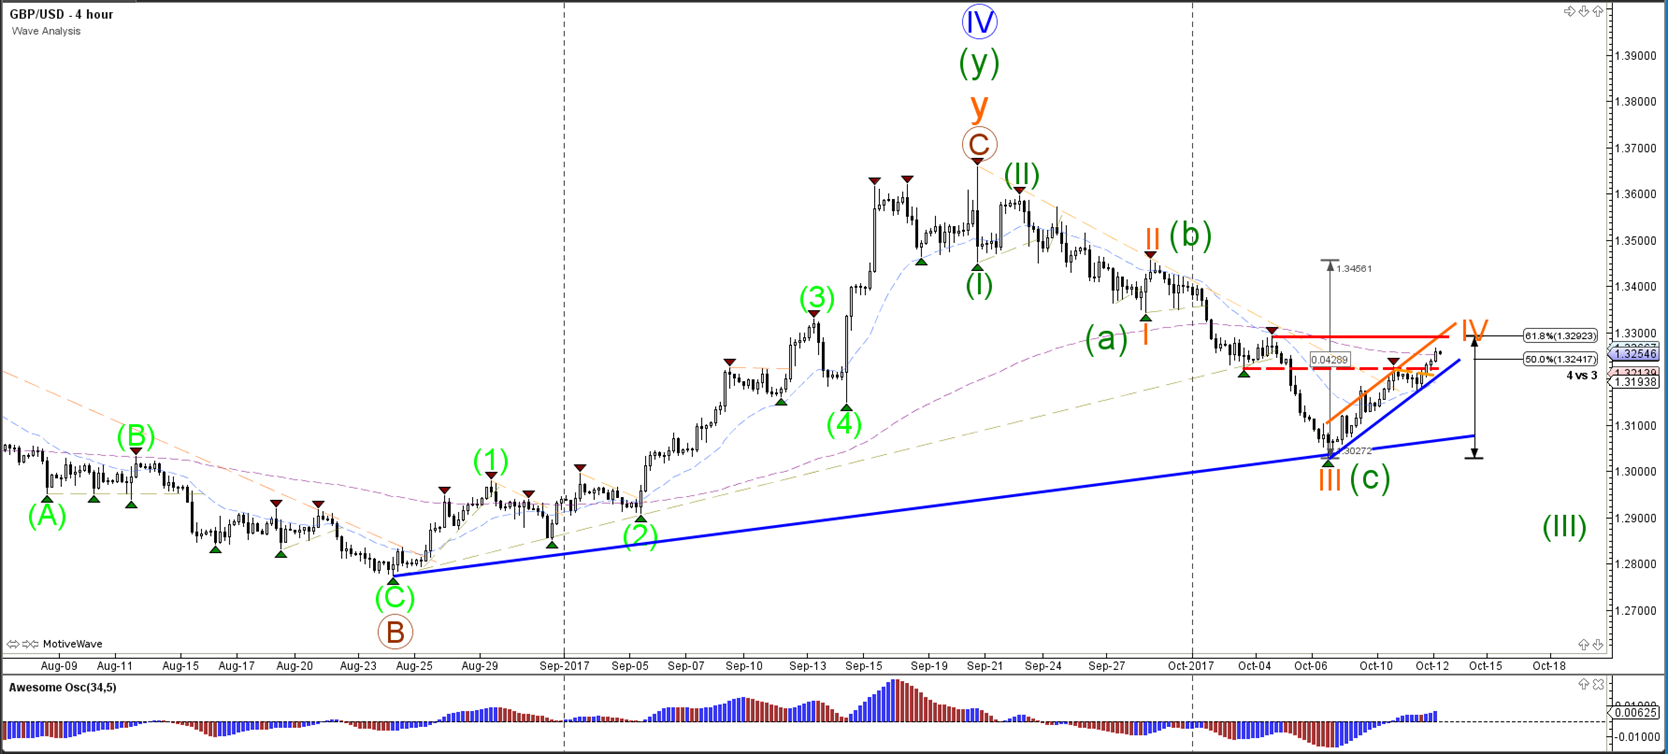
The GBP/USD bullish channel (blue/orange lines) is challenging the Fibonacci levels of wave 4 (orange). A break above the 61.8% Fib makes a wave 4 less likely and could indicate a larger bullish reversal. In that case, an ABC (green) correction has probably occurred. However, a failure to break the resistance zone but a break below the channel could spark a bearish continuation to test the outer trend line connecting the wave 3 (orange bottom).
1 hour
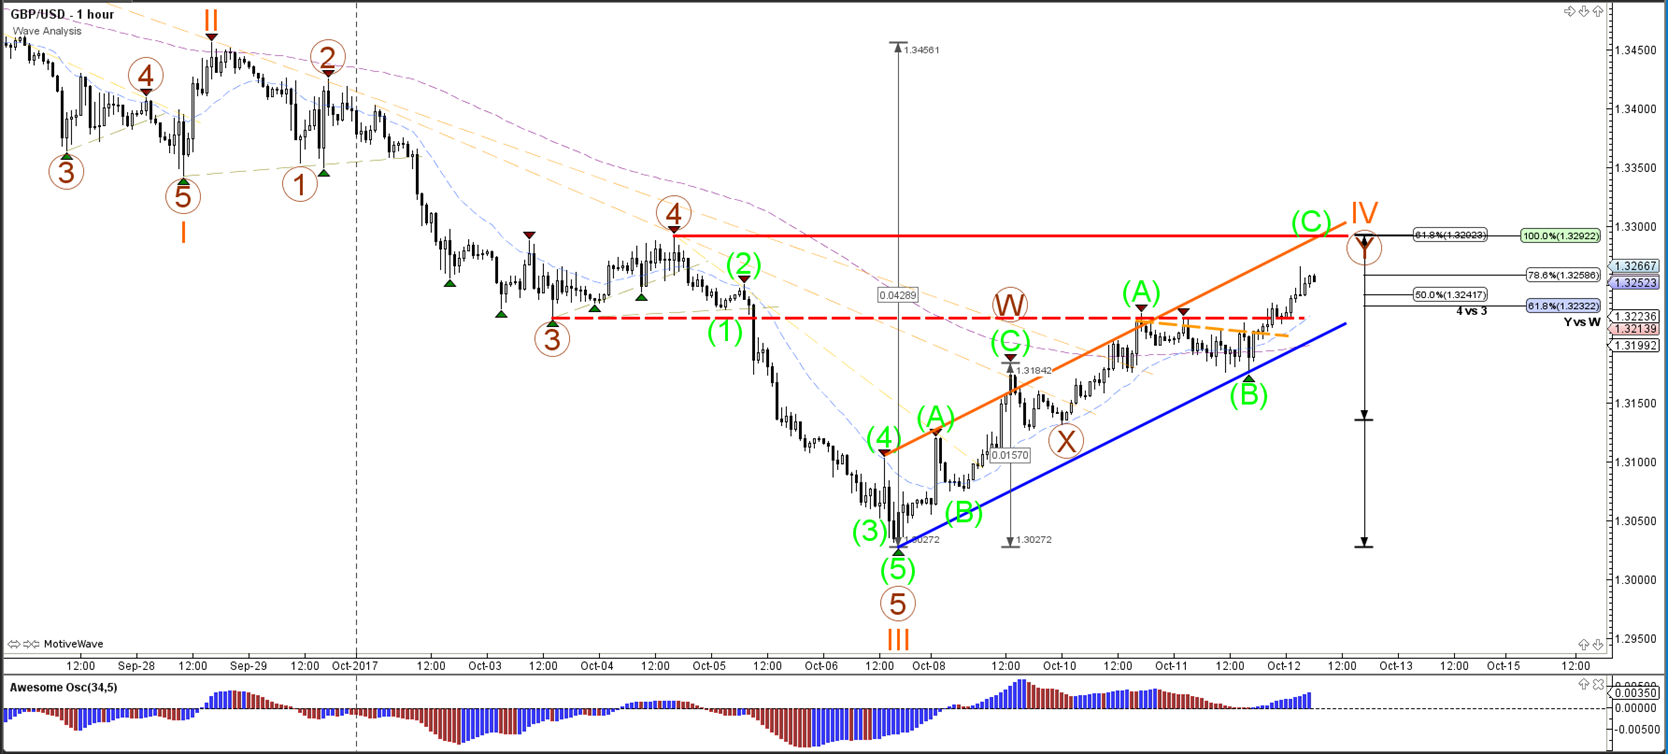
The GBP/USD bearish break below the support trend line (blue) could indicate the completion of wave 4 (orange) and the continuation of the downtrend. A break above the resistance top and 61.8% Fib makes a wave 4 less likely. For the moment an ABC (green) zigzag correction could be taking place.
4 hour
1 hour
Origin: Admiral Markets