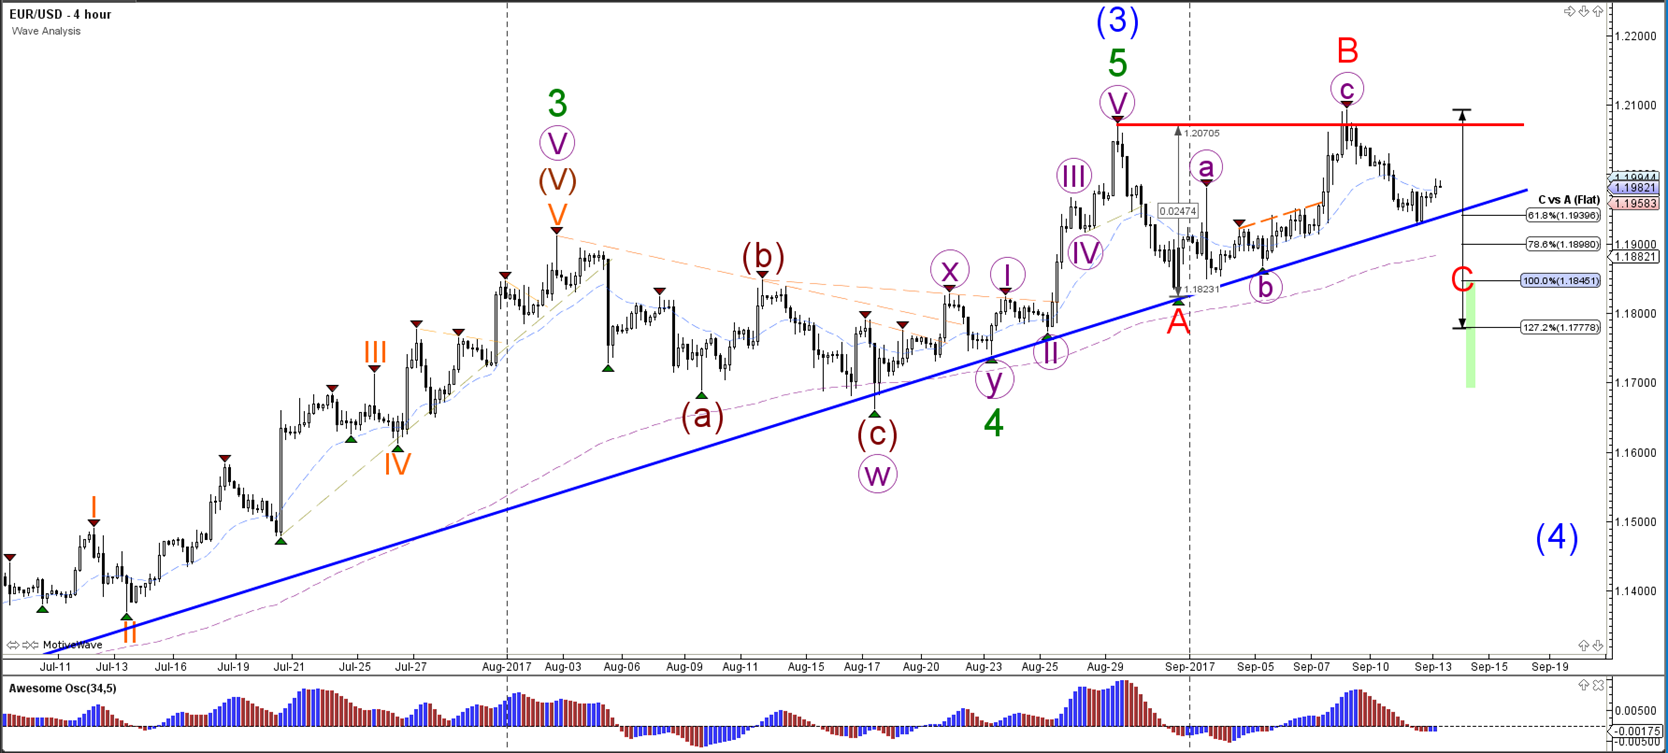
 4 hour
The EUR/USD could have completed the wave C (red) of wave 4 (blue) at the support trend line (blue) and 61.8% Fibonacci level of wave C vs A.
This could be a potential bouncing spot for a continuation of wave 5 but wave C could extend lower if price breaks below the support line.

1 hour

The EUR/USD seems to have completed 5 bearish waves and has broken above the resistance trend line (dotted red) which could indicate a potential bullish breakout via a wave 1-2 (purple).


