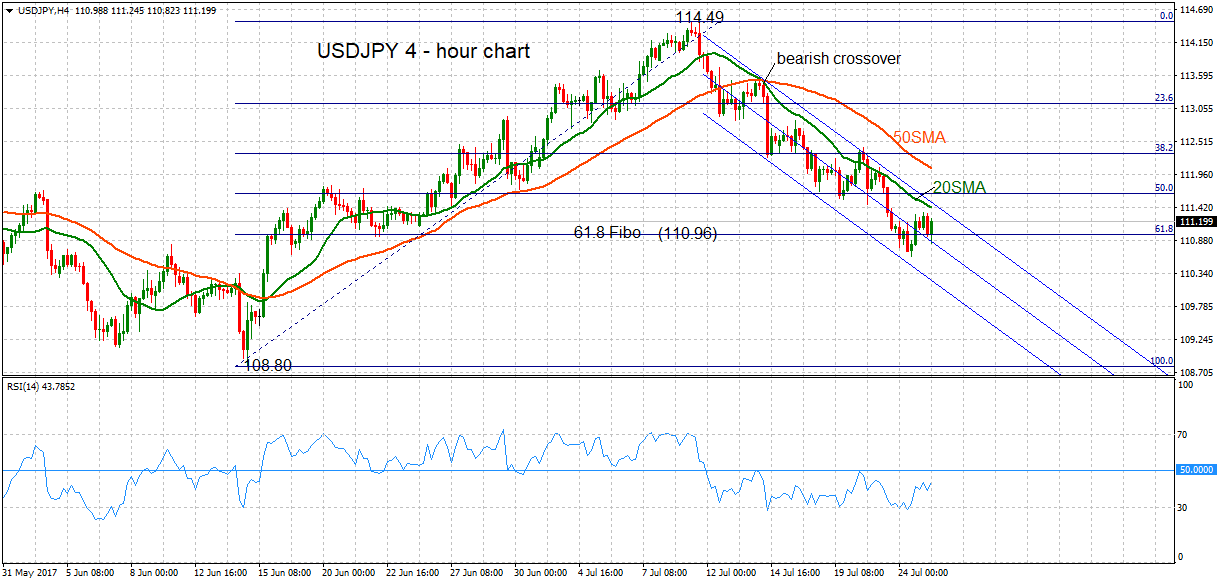
 USDJPY has turned increasingly bearish on the 4-hour chart. The pair has been falling in a descending channel since the July 11 high of 114.49.
Support was found at 110.96, which is the 61.8% Fibonacci retracement level of the upleg from 108.80 to 114.49 (June 14 to July 11). This is now an important area around which the pair has been pivoting. Consolidation is expected in the near term, unless there is a break below this support, in which case prices could accelerate their decline towards 108.80.
The technical picture is looking very bearish and the 4-hour chart is showing clear signs of a reversal of the previous June to July uptrend. There was a bearish crossover of the 20 SMA with the 50 SMA on July 14. These moving averages are negatively aligned and downward sloping, which further highlights the bearish bias. Meanwhile, RSI is below 50 in bearish territory, although it appears to have lost downside momentum, suggesting consolidation in the near term.
USDJPY would have to rise above 111.64, which is a key resistance level provided by the 50% Fibonacci in order to see a weakening in the bearish bias. This resistance level was previously a support level and would be quite challenging to break. From here, another resistance level comes in at 112.30, the 38.2% Fibonacci, which also acted as resistance recently and support in the past.
The short-term outlook for USDJPY is bearish as long as prices remain in the descending channel. The intra-day bias is neutral as consolidation is expected around the 61.8% Fibonacci level.
Origin: XM