


 4 hour
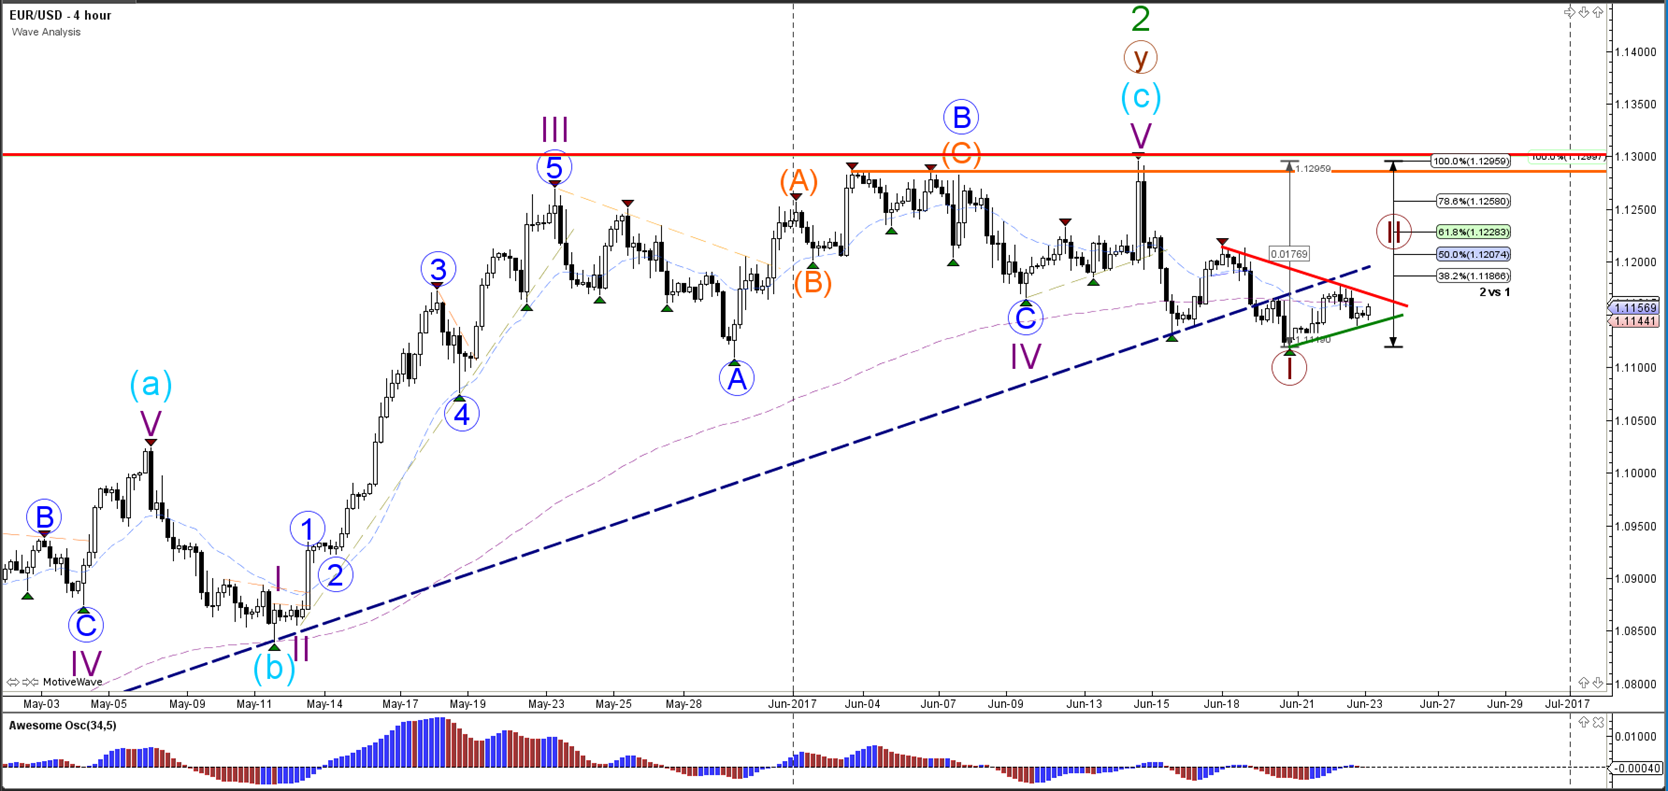
The EUR/USD is probably building a break, retracement, and continuation, which is why waves 1 and 2 (brown) are indicated on the chart.
Price will need to break below the bottom at 1.11 before a potential wave 3 becomes likely.
1 hour
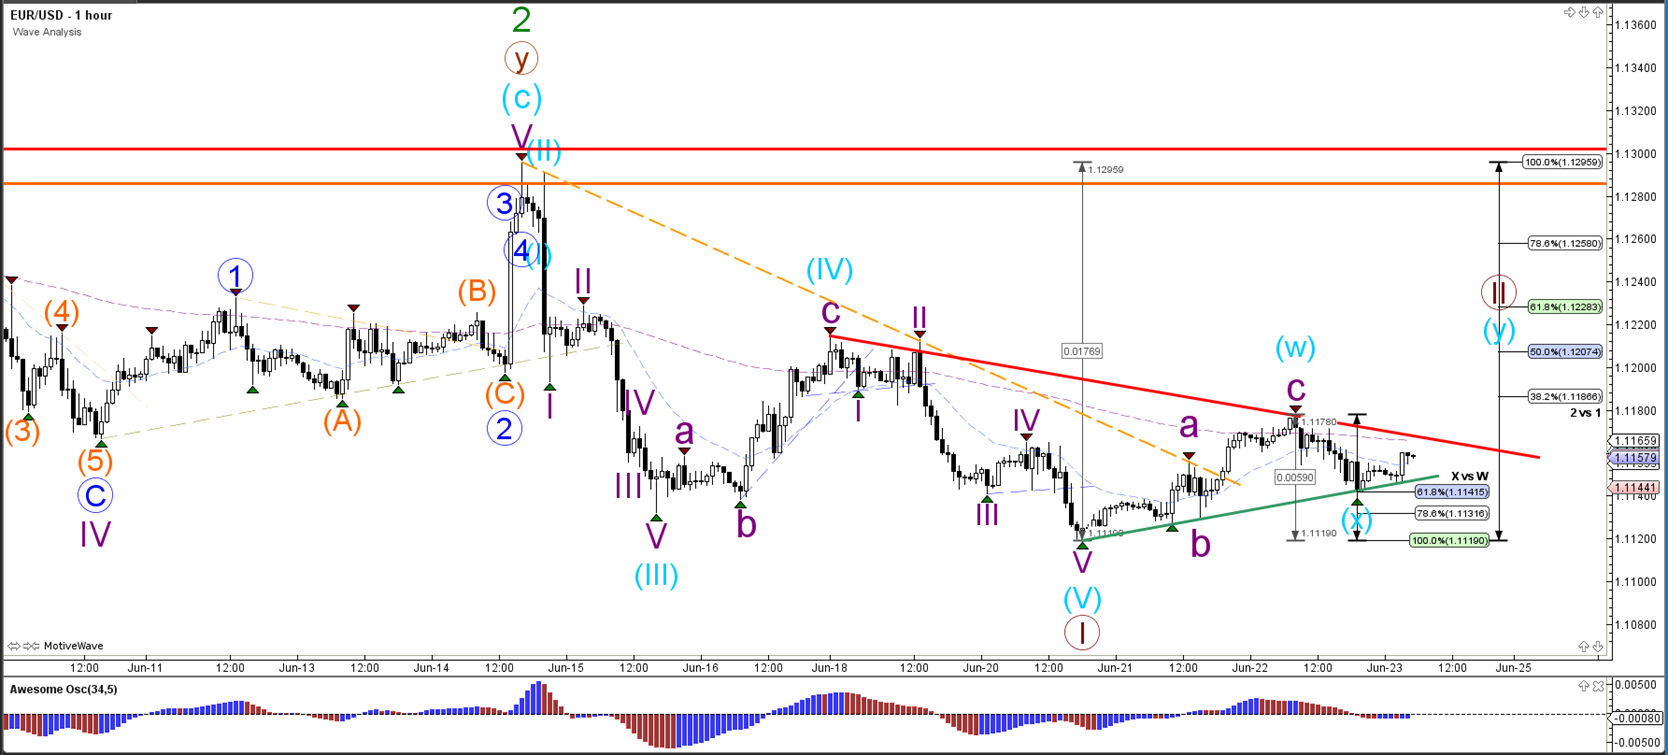
The EUR/USD stopped at the 61.8% Fibonacci level of wave X (blue). A break below support (green) could indicate a continuation of the bearish trend. Price invalidates wave 2 (brown) if price manages to break above the 100% Fibonacci level but the other Fibonacci levels could act as resistance – similar to how price bounced at the 38.2% of wave 2 (brown).
Origin: Admiral Markets


