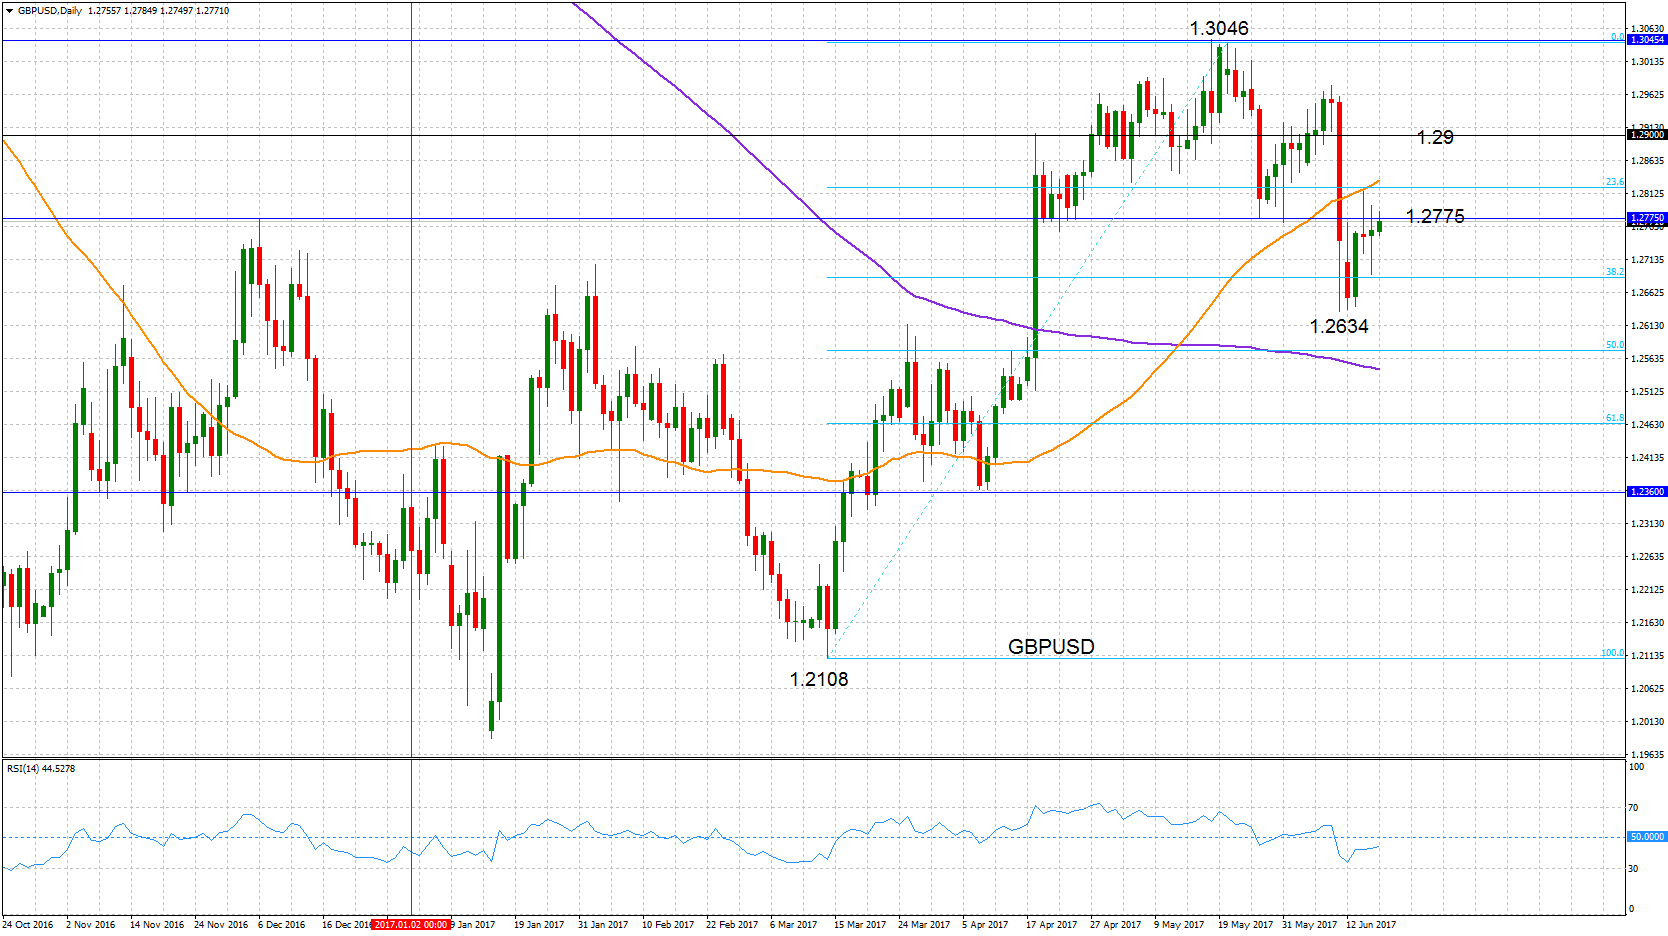
 GBPUSD turned bearish in the short term after the pair’s fall from the May 18 high of 1.3046 to the June 9 low of 1.2634. There was a bounce from this level but resistance was found at the 50-day moving average and at the 23.6% Fibonacci retracement level at 1.2821. This is the retracement of the upleg from 1.2108 to 1.3046. Following a pullback from this resistance area, the market is consolidating just below 1.2775, which is now immediate resistance but was support in the past.
It remains to be see whether this bounce from 1.2634 is a temporary correction before a resumption of the downtrend that started from 1.3046. Downside momentum has faded after the RSI’s dip below 50 has resulted in a flattening of the oscillator. But it still remains in bearish territory.
A break below 1.2634 and below important support at the 50% Fibonacci at 1.2574 would increase downside momentum. A deeper decline from here would bring about a resumption of the downtrend from 1.3046.
But looking at the bigger picture, an uptrend was forming from the rise from 1.2108 to 1.3046. This bullish picture is still in place. A rise back into the 1.2900 handle could see a re-test of 1.3046 and push prices higher in order to resume this uptrend from 1.2108.
Origin: XM