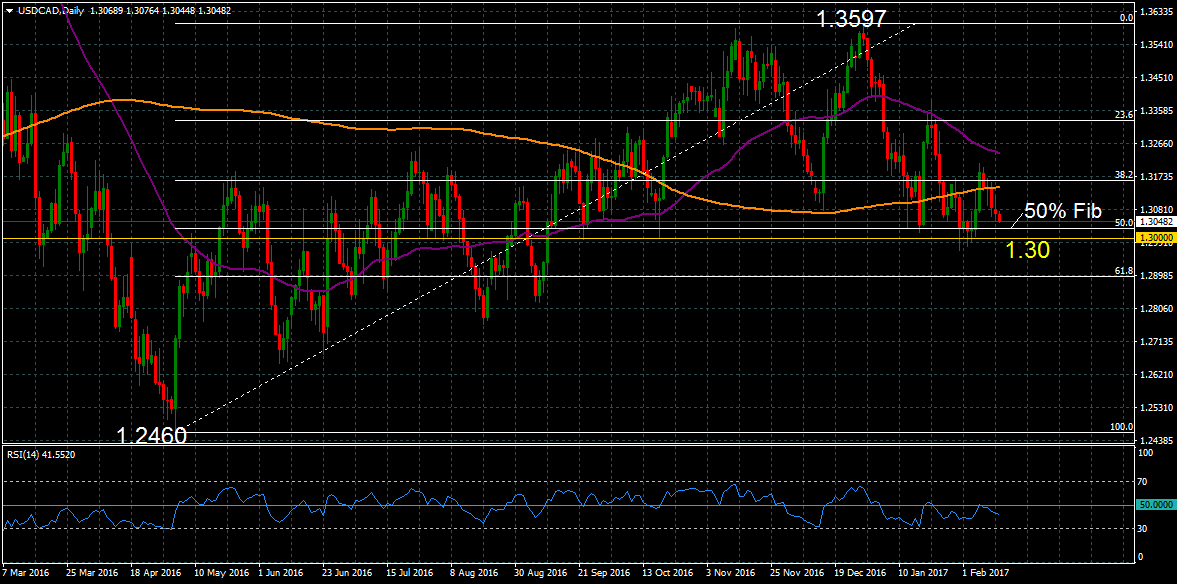
 USDCAD has been testing the 50-day moving average in the past three weeks. The immediate risk is to the downside, as RSI is trending down. The 200-day moving average is sloping down as well, suggesting the bias has shifted to the downside.
The market is now approaching a critical area where important support levels are likely to be provided by the key 1.3000 level and the level at 1.3028, which is defined by the 50% Fibonacci retracement level of the upleg from 1.2460 to 1.3597. (May to December 2016). Further support comes into view at 1.2895 (61.8% Fibonacci level) and then at 1.2821(September 2016 low).
Prices would need to clear resistance levels at 1.3142 (50-day moving average) and at 1.3163 (38.2% Fibonacci level) in order to weaken the immediate downside pressure. A rise above 1.3328 (23.6% Fibonacci) would bring the December peak of 1.3597 into view. Surpassing this high would result in a resumption of the uptrend that start from the May 2016 low of 1.2460.
In the short term, the market appears to be basing just above the key 1.30 level and is expected to consolidate in this area for now. Until this important level is breached, USDCAD maintains the long-term bullish market structure that is defined by the May to December uptrend.

Origin: XM


